


For councils, universities, government and property owners

Know how your places are really used.

We install privacy-safe sensors in your buildings and public spaces, then turn the counts into live dashboards, alerts, reports and AI forecasts. So you can keep people safe, run spaces efficiently and invest with evidence.

  • Sensors, install & support included
  • No images stored or sent
  • Australian team
Animated illustration of a library with live occupancy in the children's area and reading room3D people counterIN +1OUT +1Children's Area29 / 30 · 97%Reading Room18 / 32 · 58%Visits today2,416
1
MeasureSensors installed in your spaces
2
UnderstandLive occupancy in every zone
3Act84% confidence

Saturday 10:30am: open the Activity Room as overflow. The Children's Area is forecast to reach 96%.

Real sensors in real places

Measuring the places Australians use every day.

Privacy-safe sensors are installed on site, at entrances, in rooms, along paths and across open spaces, so you see how each place is really used.

Browse all places

Hardware & install, included

The sensing is ours to deliver, not just the software.

An overhead 3D sensor counts people by their shape and height, never their faces, with all the counting done on the device. Our Australian team surveys, installs, calibrates and supports every one.

See how the platform works

Anonymous by design

The sensor builds a 3D depth view and counts by shape and height from above. No faces and no images — only anonymous numbers ever leave the device.

Accurate on its own

A dedicated AI processor inside each unit counts on the spot, up to 99.8% accurate through busy crowds, shadows and low light.

Installed and supported by us

One cable carries power and data. Our local team fits, calibrates and monitors every device, permanent or temporary.

See it in action

How counting works in every kind of place.

A 3D people counter watches each entrance or zone, counts people in and out on the device, and sends anonymous numbers to the platform in seconds.

Animated illustration of a library with live occupancy in the children's area and reading room3D people counterIN +1OUT +1Children's Area29 / 30 · 97%Reading Room18 / 32 · 58%Visits today2,416
Libraries: visits at the door and live occupancy in every zone.
Animated illustration of a lecture theatre and study space with room occupancy counted at the door3D people counterIN +1OUT +1Lecture theatre34% · 82 of 240Study space14 seats freeBooked 240 · used 82
Campuses: booked versus used, room by room.
Animated illustration of a shopping centre mall with footfall counting at the entrance and visitor flow3D people counterIN +1OUT +1Average dwell00:45Footfall today18,940Food court · 84%
Shopping centres: footfall, flow between zones and dwell time.
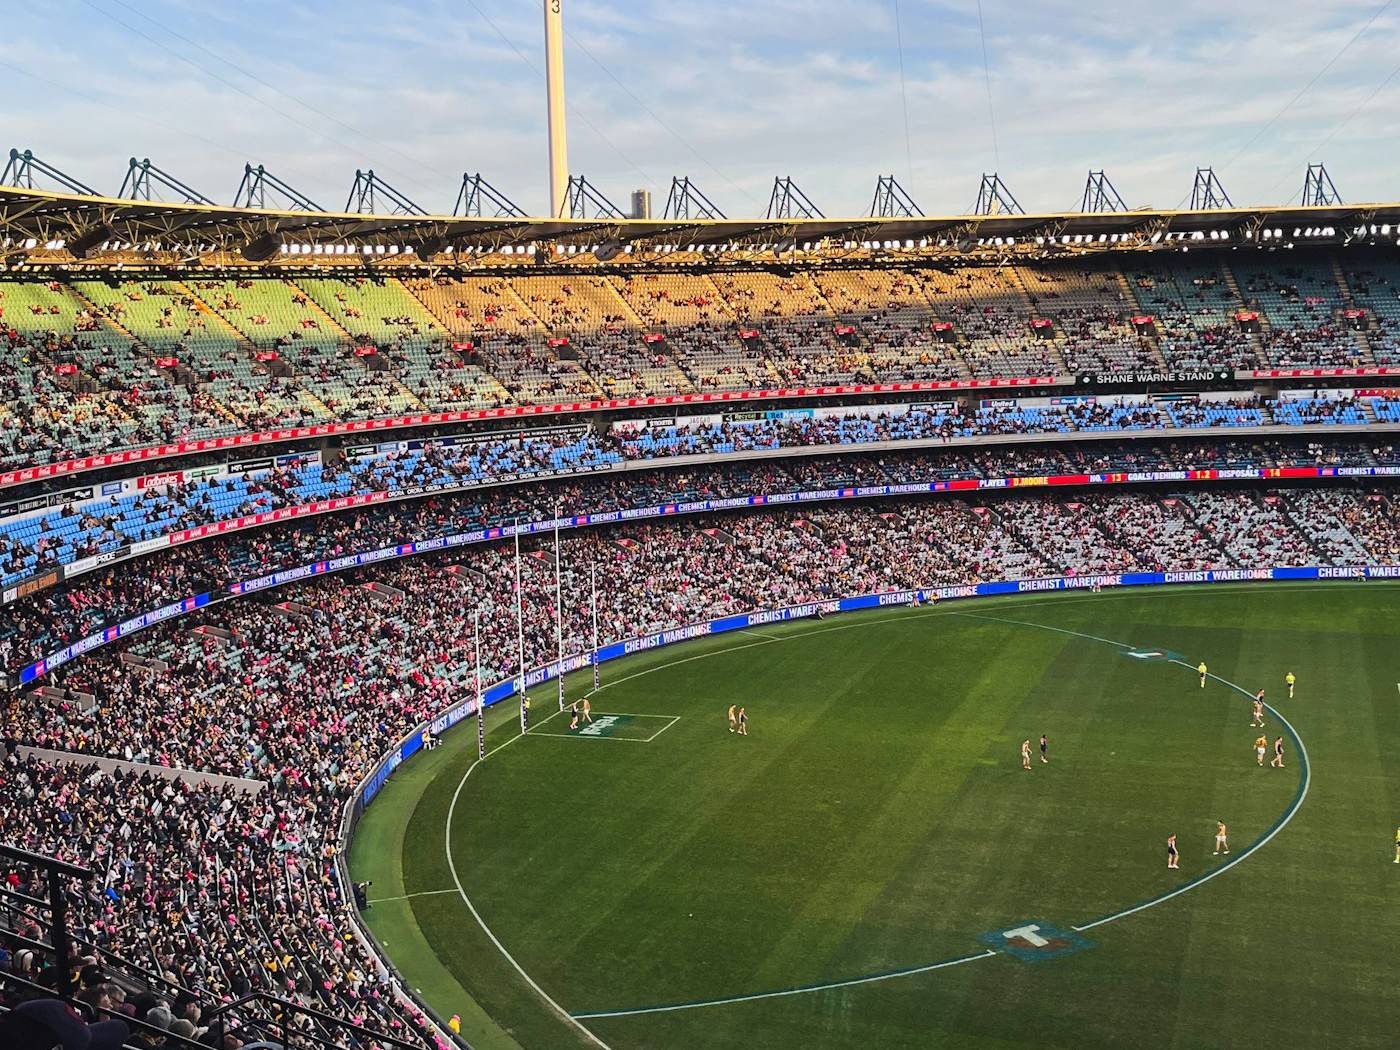
Animated illustration of stadium gates counting arrivals with live attendance and a capacity alert3D people countersIN +1IN +1IN +1Concourse92% of limitLive attendance41,862Alert sent · Gate A busy
Stadiums and venues: arrivals by gate and live crowd capacity.
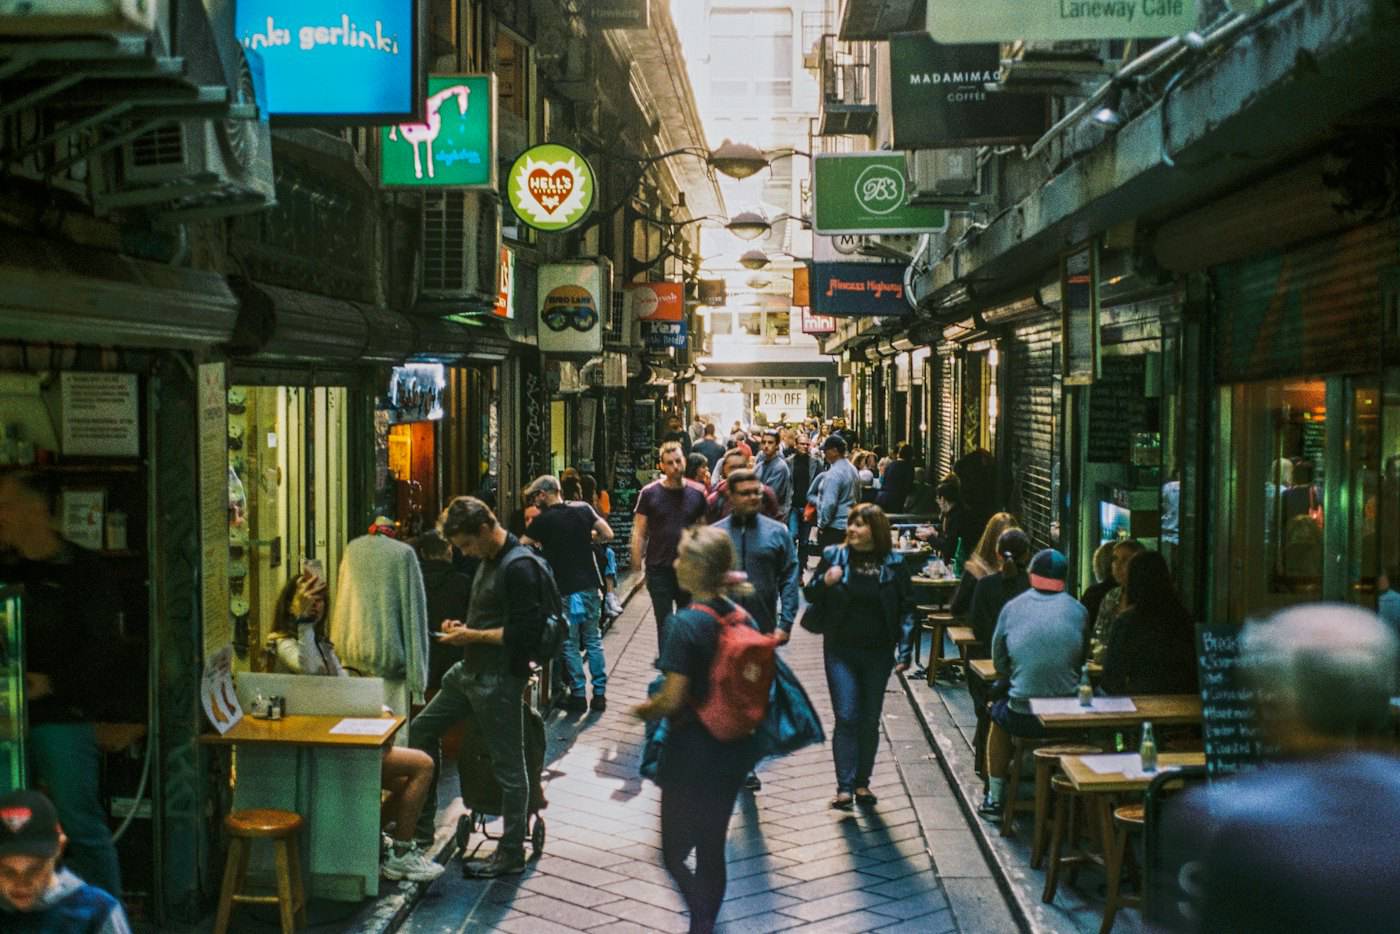
Animated illustration of a laneway with a pole-mounted pedestrian counter and people walking both waysPedestrian counter+1+1Pedestrians today8,412Peak · 12:30pm
Streets and laneways: pedestrian counts by hour and direction.
Animated illustration of a park path with a counter measuring walkers and cyclistsPath counterCyclist +1Walker +1Visitors today3,207Cyclists today1,142
Parks and foreshores: walkers and cyclists, by direction and season.
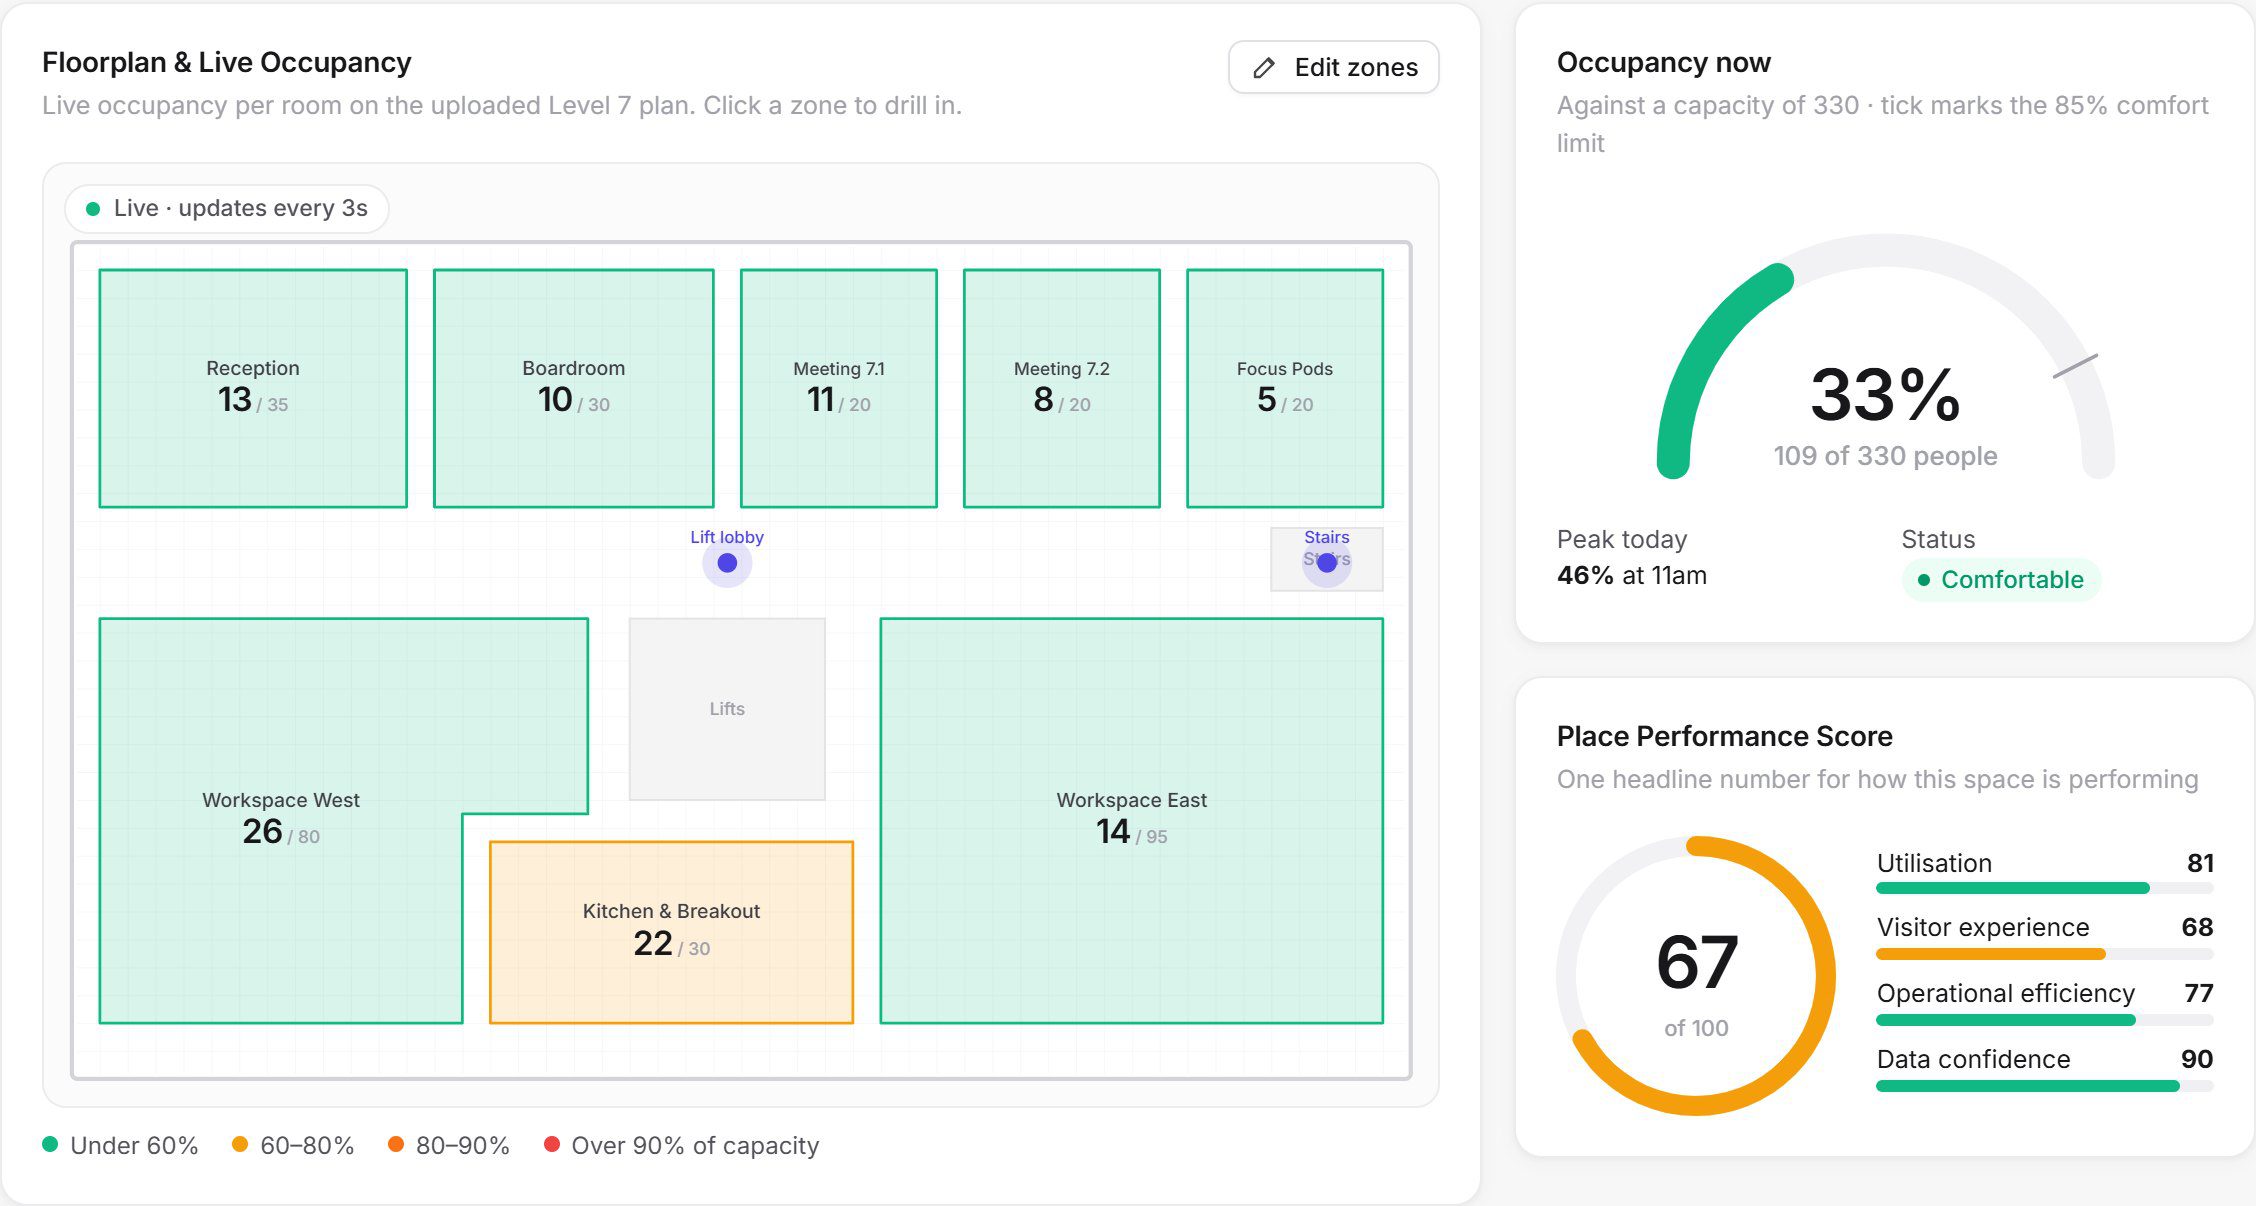
Animated illustration of an office floor with meeting room occupancy and lift lobby counting3D people counterIN +1OUT +1Meeting 7.13 / 8 seatsMeeting 7.2Free nowLevel 761 of 160 peopleKitchen busy 12:30
Office towers: floors, meeting rooms and amenities, used on demand.
Animated illustration of a government service centre with queue monitoring and entrance counting3D people counterIN +1OUT +1Queue6 people · wait 5 minServed today312Target: under 10 min
Service centres: queue length, wait times and visits.

One partner, end to end

From the sensor on the ceiling to the decision in the boardroom.

Most analytics projects stall between hardware, software and insight. Place Performance delivers all three as one service, so you get trustworthy numbers from day one and the intelligence to act on them.

Explore the platform

Sensors & cameras

3D people counters and the right sensor for each space: entrances, rooms, outdoor paths, cyclists and vehicles.

Edge processing

Counting happens on the device and data is masked at source. Only anonymous numbers leave the site, never images or identities.

Analytics platform

Live occupancy, floorplans, trends and benchmarking across every site, space and zone you manage.

Insight & action

Alerts, scheduled reports, forecasts and AI recommendations that tell you what to do next.

Animated illustration of a 3D people counter above a doorway counting people in and out3D people counterIN +1OUT +1IN +1In today1,284Out today1,197
Entrance counting: people in and out, processed on the device.

Hardware included

We start with your question, not with a device.

Every place is different. Before anything is installed, our team assesses the environment, movement patterns, coverage, connectivity, power and privacy needs, then selects the technology that fits.

  1. Assess. What do you need to understand, and where? Entrances, floors, rooms, paths, roads or open spaces.
  2. Select. 3D people counters for entrances and areas, plus specialist sensors for cyclists, vehicles and outdoor spaces.
  3. Install and commission. Designed, supplied, installed and calibrated by our Australian team, permanent or temporary.
  4. Support. Every device reports a heartbeat. Local experts keep the system accurate and expand it as your needs change.

One service

Proven hardware, local expertise and an intelligent platform, delivered together.

Proven hardware

3D people counters

Commercial-grade 3D sensors with all processing on the device and no personal data collected, plus specialist sensors for cyclists, vehicles and outdoor spaces.

How counting stays anonymous
Local expertise

Australian team

We survey, design, install, calibrate and support every deployment, from the first site visit to ongoing maintenance and expansion.

How we deliver
Intelligent platform

Place Performance

Real-time dashboards, live floorplans, alerts, reporting, forecasting and AI insights across every site, space and zone.

Try the live demo

Real time

See every room, floor and site as it happens.

Occupancy refreshes every few seconds on interactive floorplans. Drill from your whole portfolio to a single room in three clicks, and get told the moment something needs attention.

How real-time monitoring works

Live across your portfolio 3,063 people now
Live floorplan with occupancy per room
Live floorplansUpload a plan, draw your rooms, watch them fill.
Site → space → zoneOne click from portfolio to a single room.
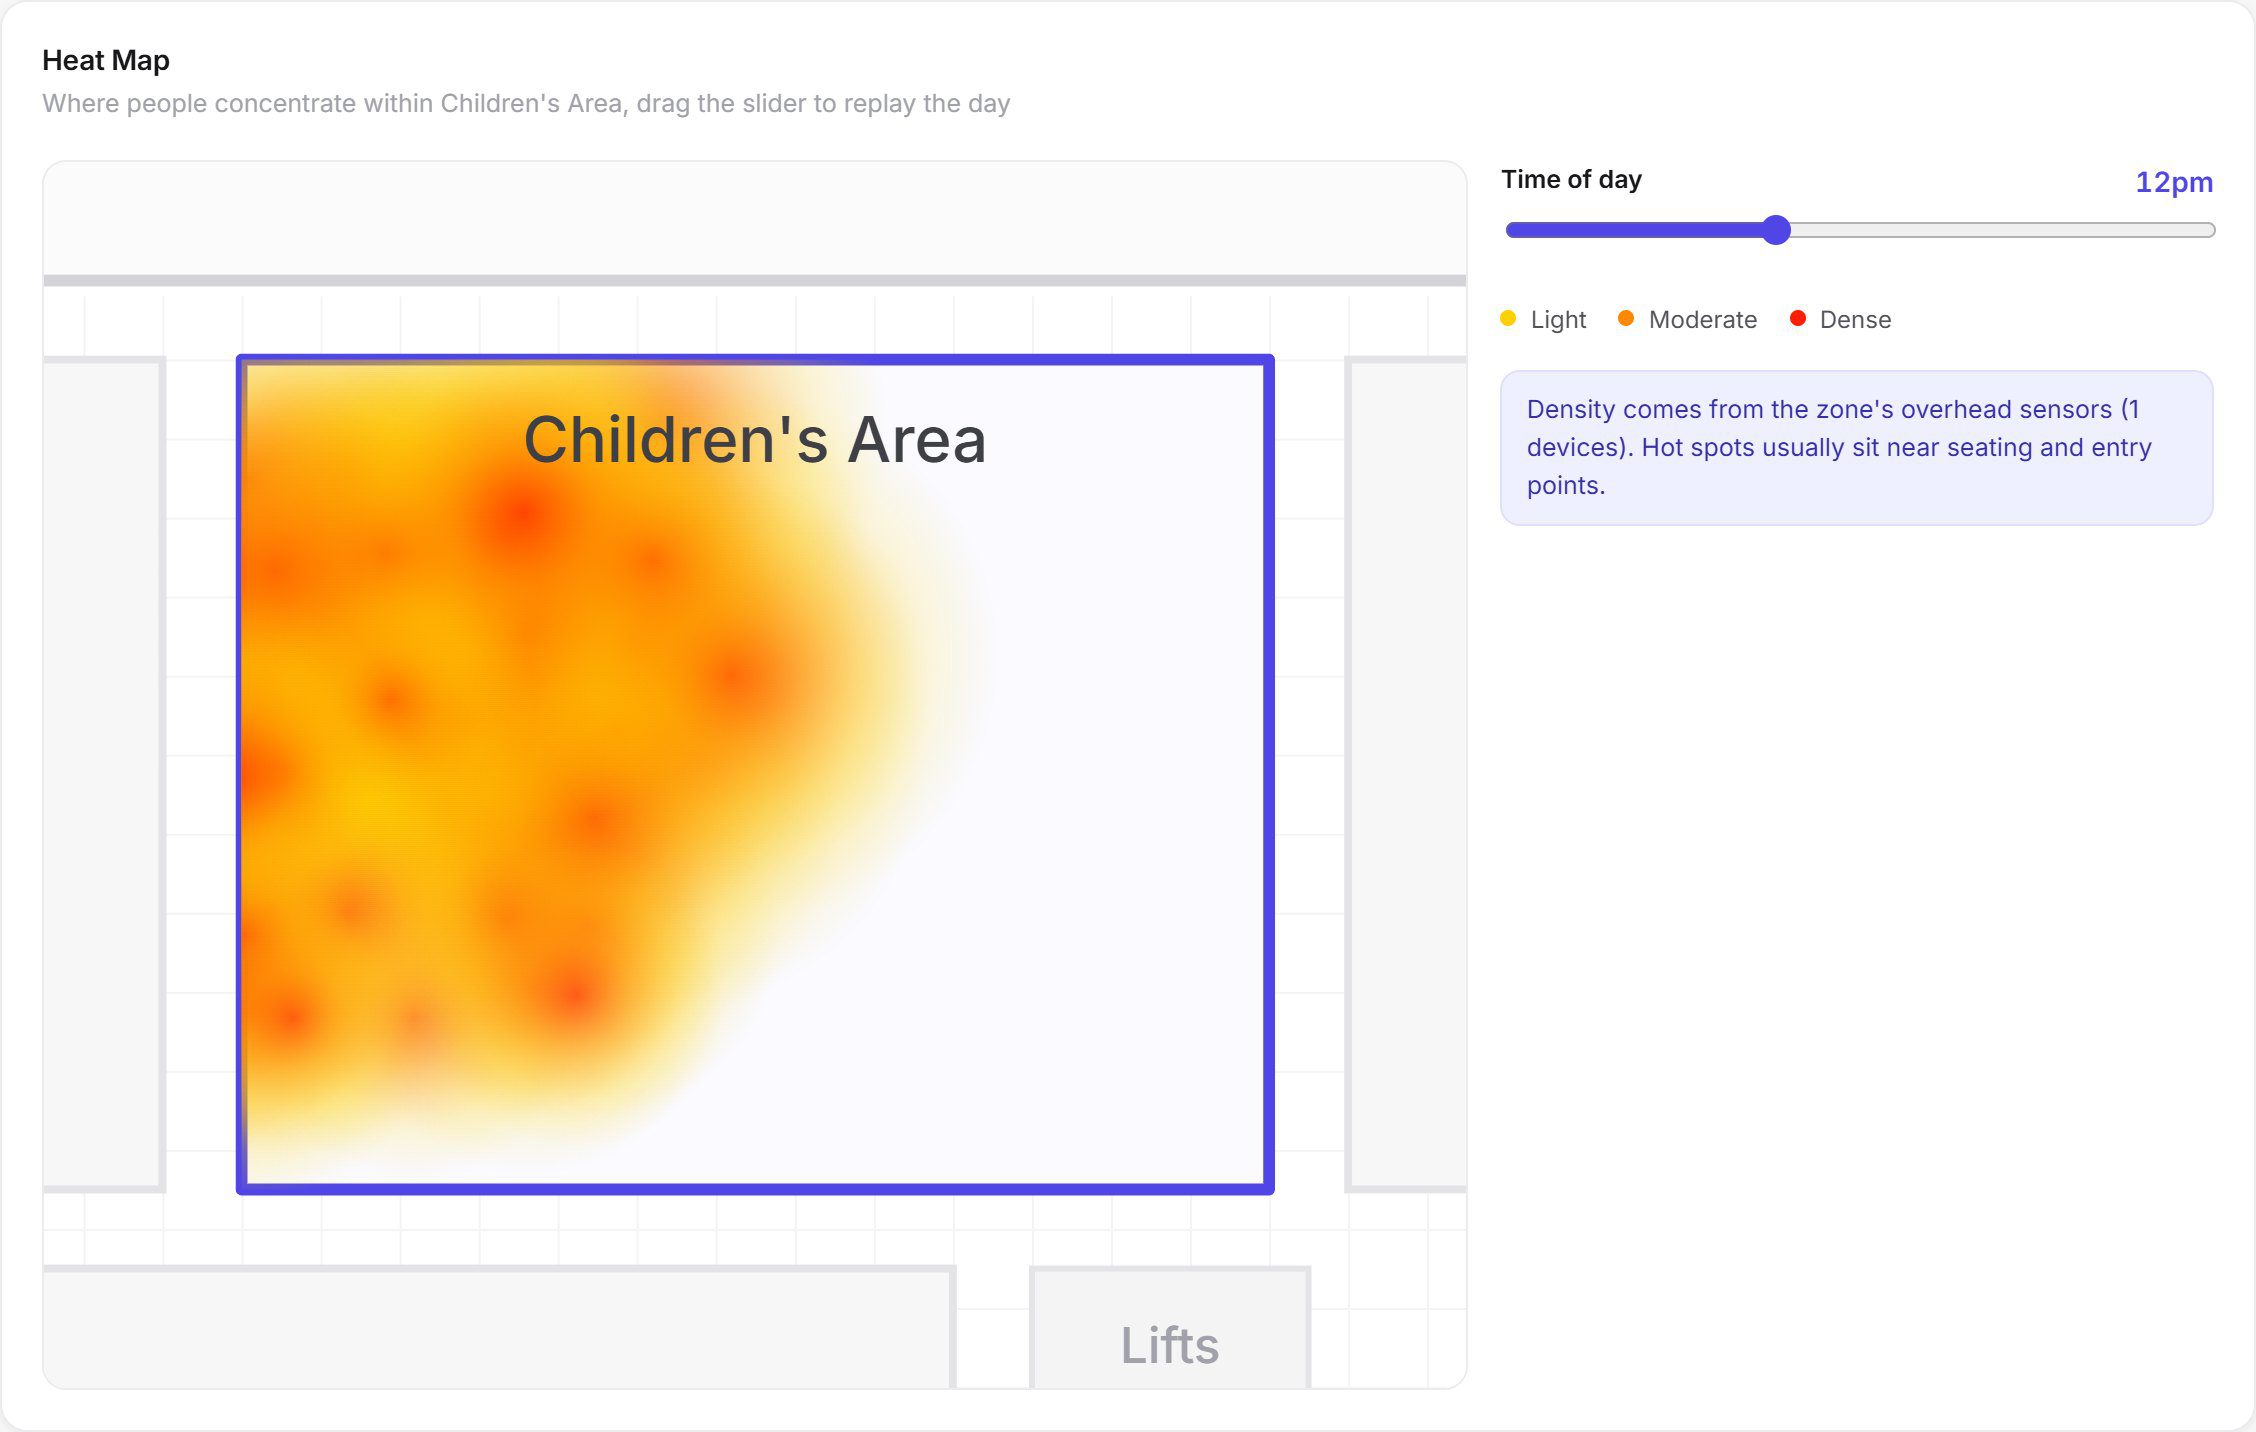
Heat maps & flowSee where people gather and how they move.

Alerts & notifications

Know before the queue forms or the room overflows.

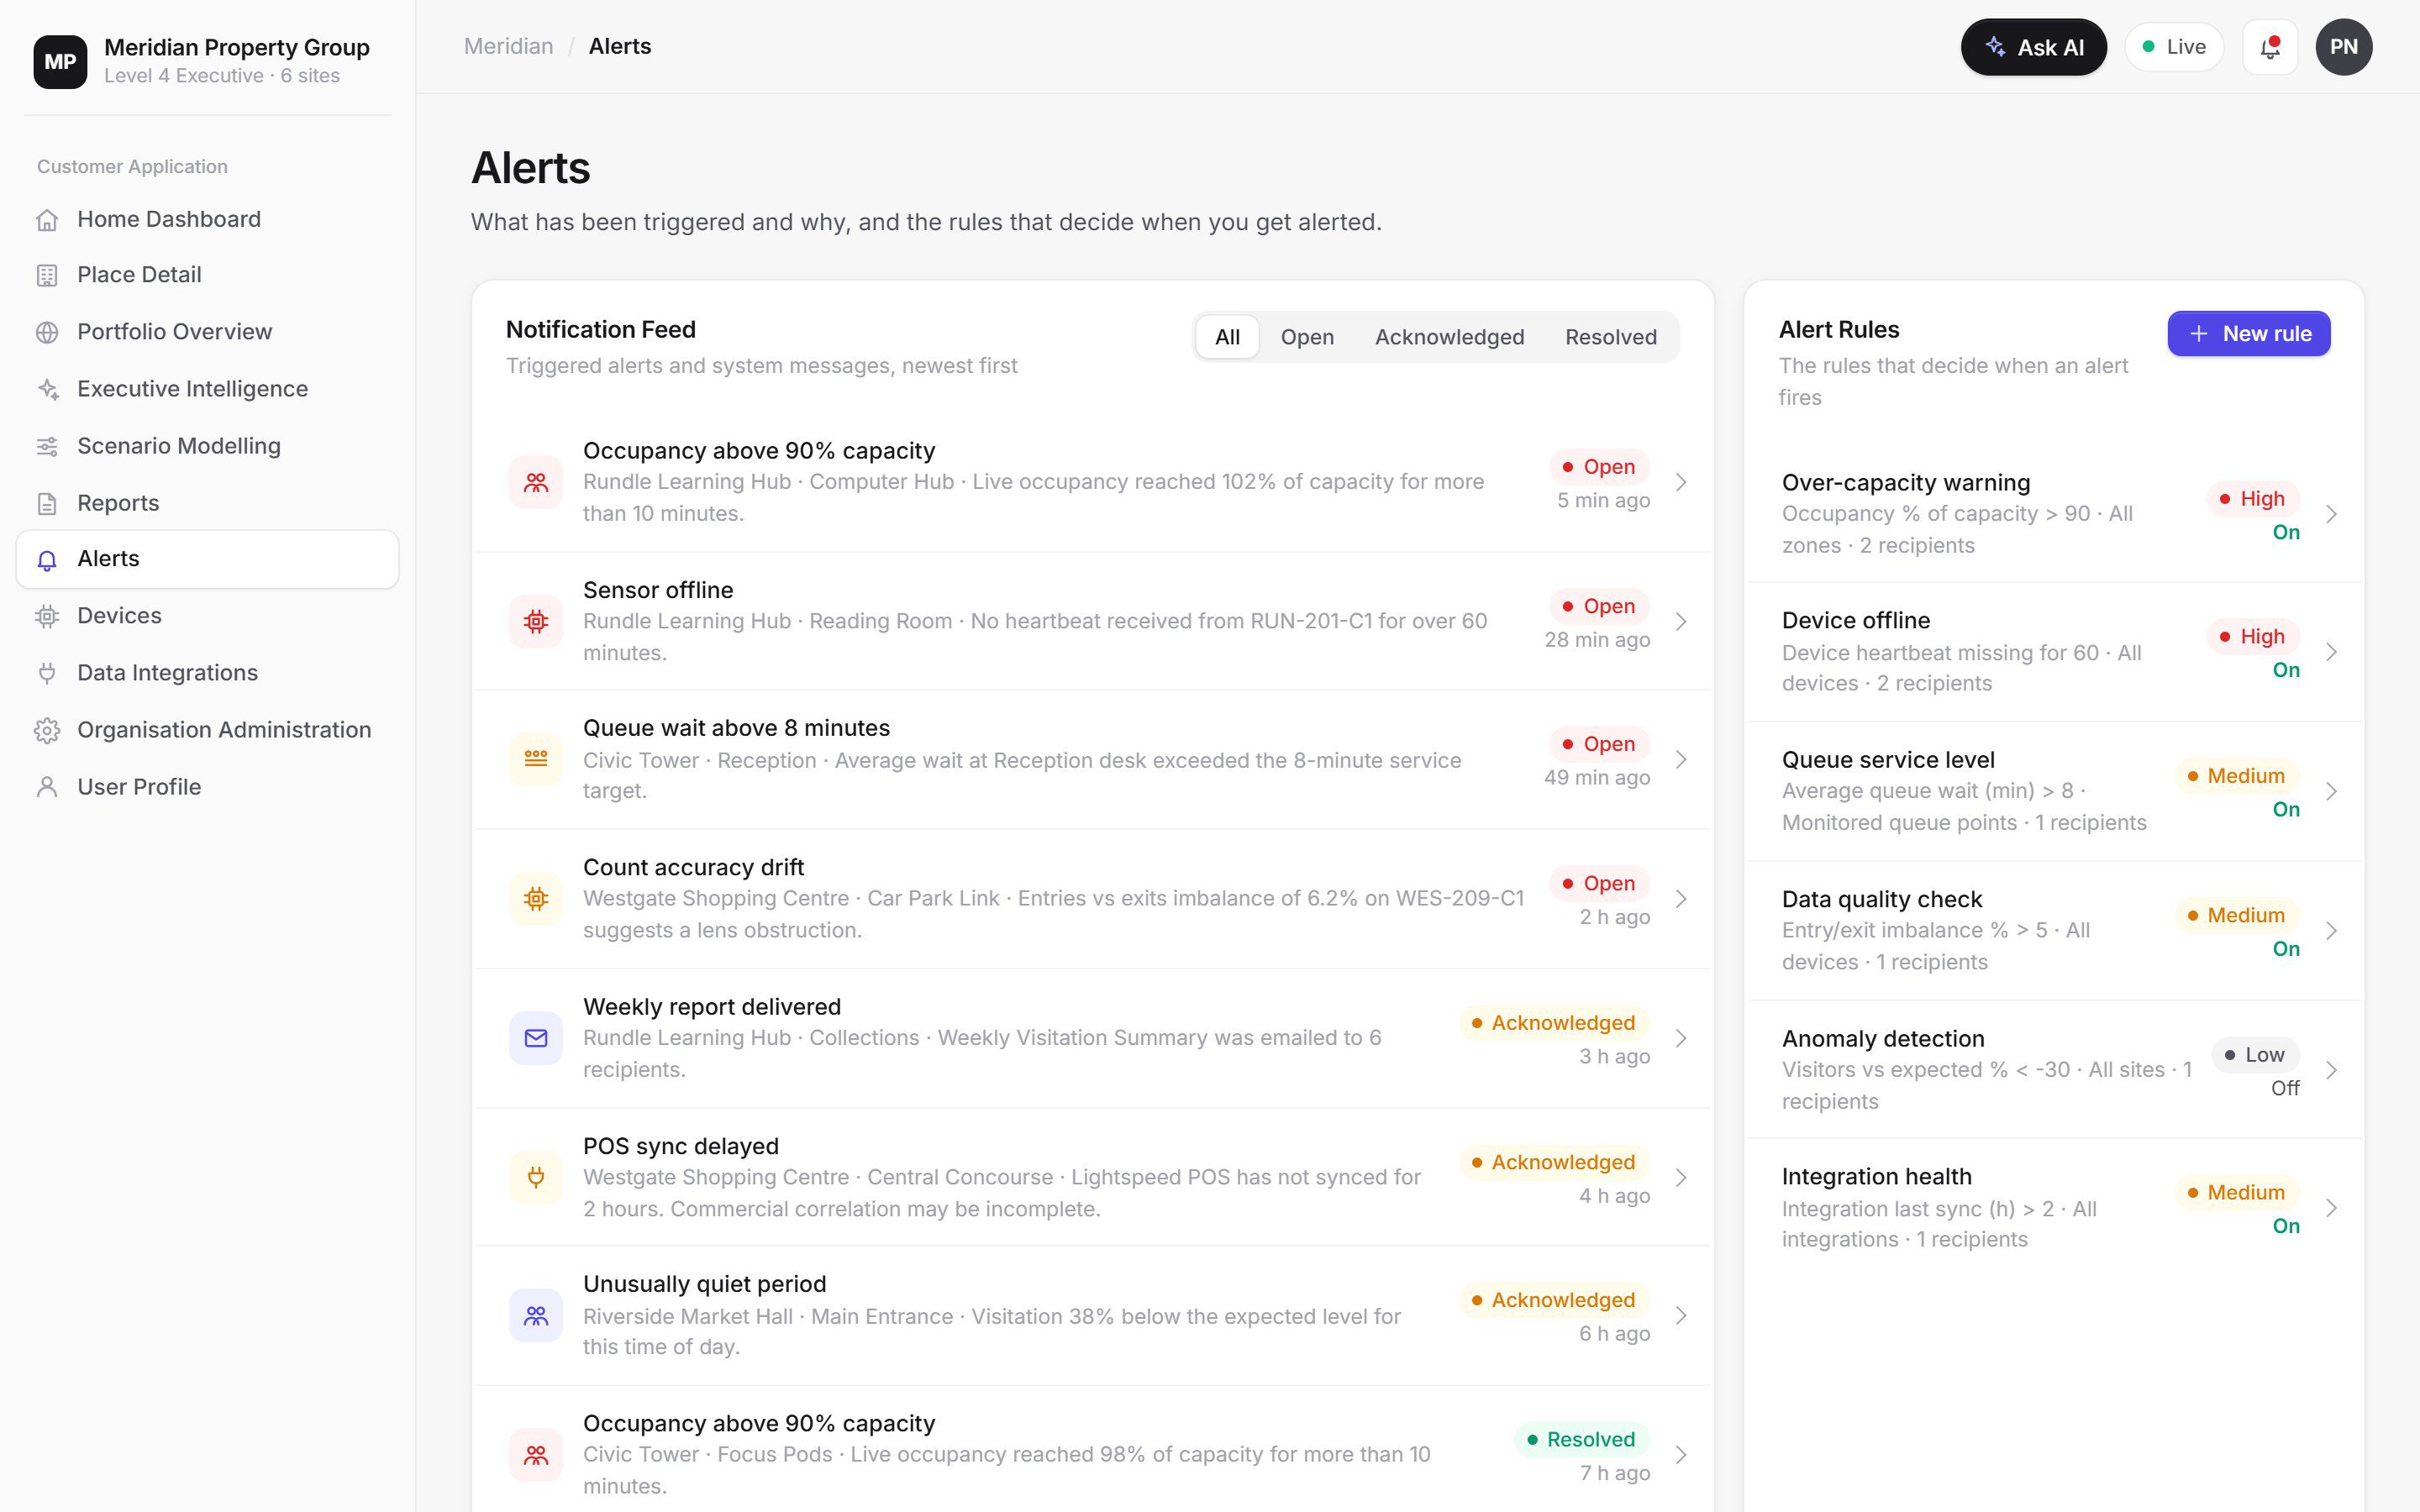
Set thresholds on occupancy, wait times, sensor health or anything unusual. The right people are notified by email, SMS, Teams or in-app, with escalation if nobody responds.

Alerts feed and alert rules

Solutions

Different places, different questions. One platform.

Councils worry about safety and service. Universities chase utilisation. Property teams need to prove value. Place Performance answers each with the same trusted data.

Crowd at a community event under the Sydney Harbour Bridge

Safer, better-run civic spaces.

Libraries, community centres, events and service desks, managed with live crowd numbers instead of guesswork.

  • Crowd capacity and safety. Live counts against fire and venue limits, with alerts before limits are reached.
  • Service levels. Queue and wait-time tracking at customer service points.
  • Opening hours and staffing. Match hours and rosters to when the community actually visits.
  • Evidence for funding. Visitation reports that prove the value of community facilities.
Place Performance for councils

Heat map of a zone
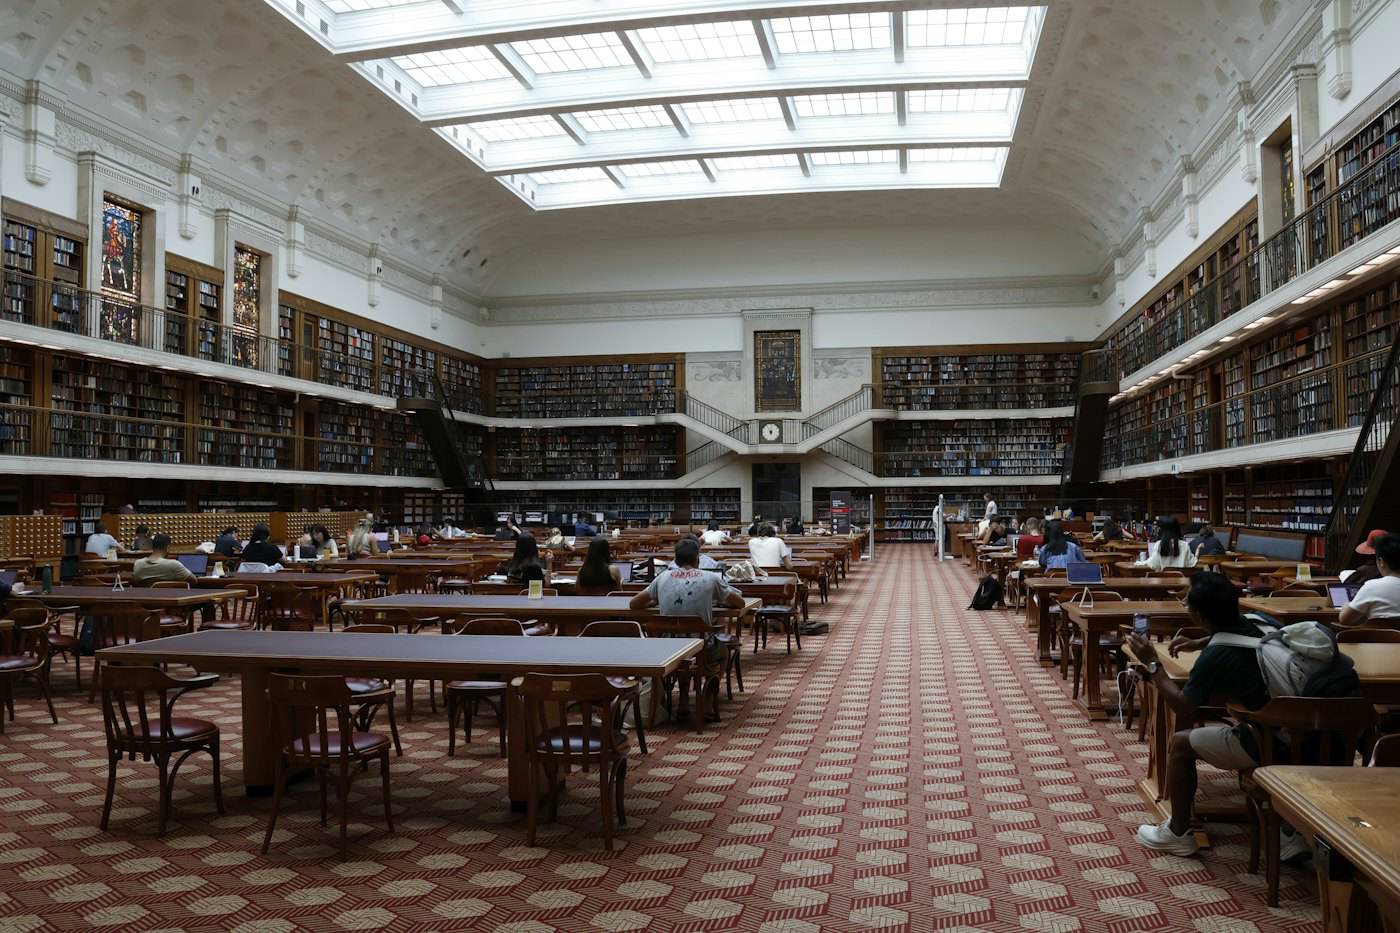
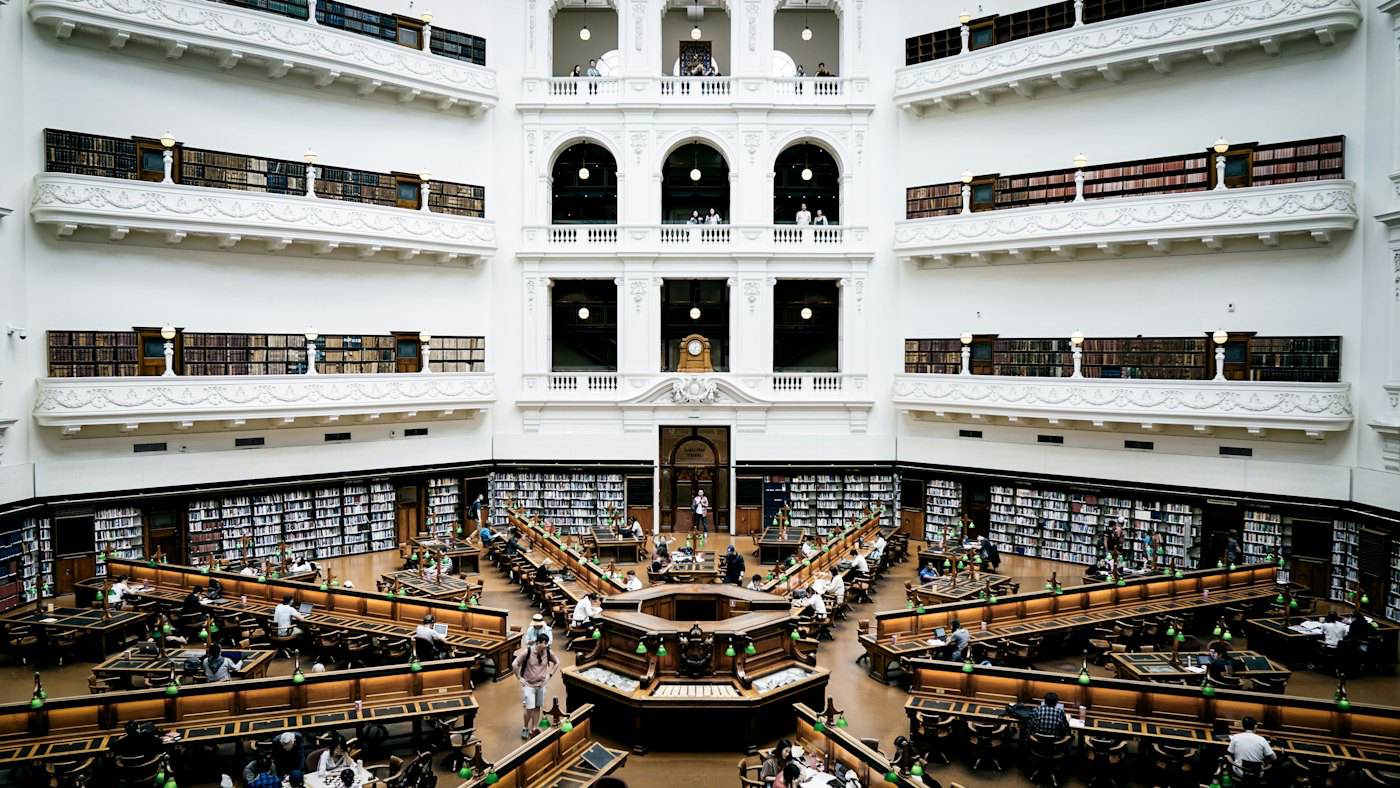
Students studying in the State Library of New South Wales reading room

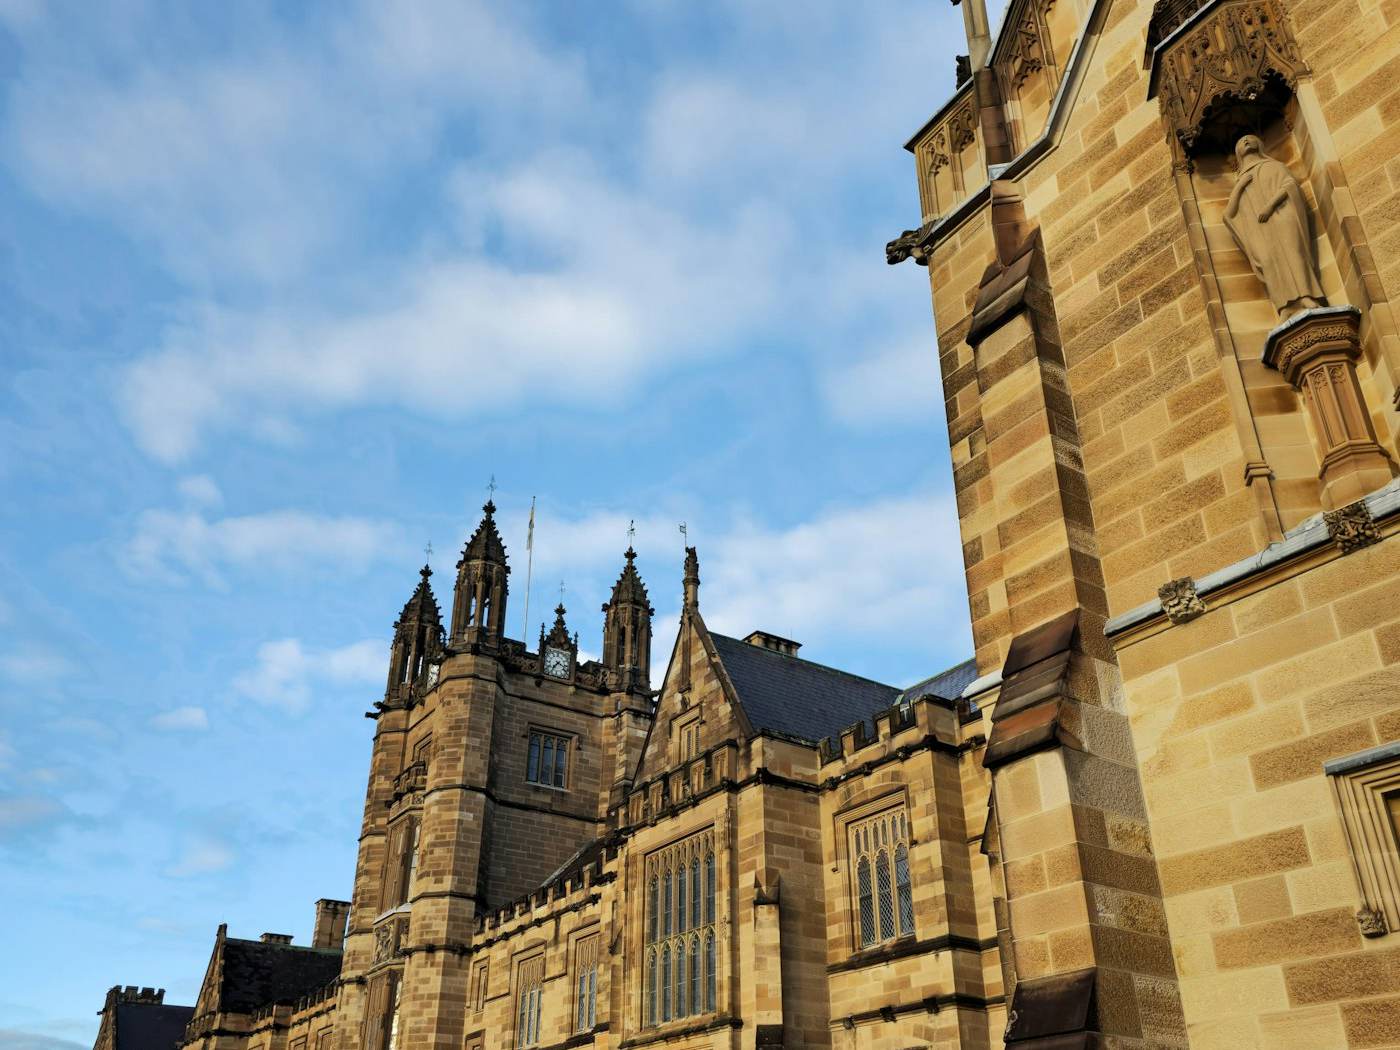
Get more from every square metre of campus.

Understand how lecture theatres, libraries and study spaces are really used, and plan capital works on evidence.

  • Space utilisation. Booked versus actually used, room by room and hour by hour.
  • Timetabling and allocation. Right-size rooms to class sizes and free up under-used space.
  • Student experience. Show students where free study space is, live.
  • Capital planning. Forecast demand before committing to new buildings.

Place Performance for universities

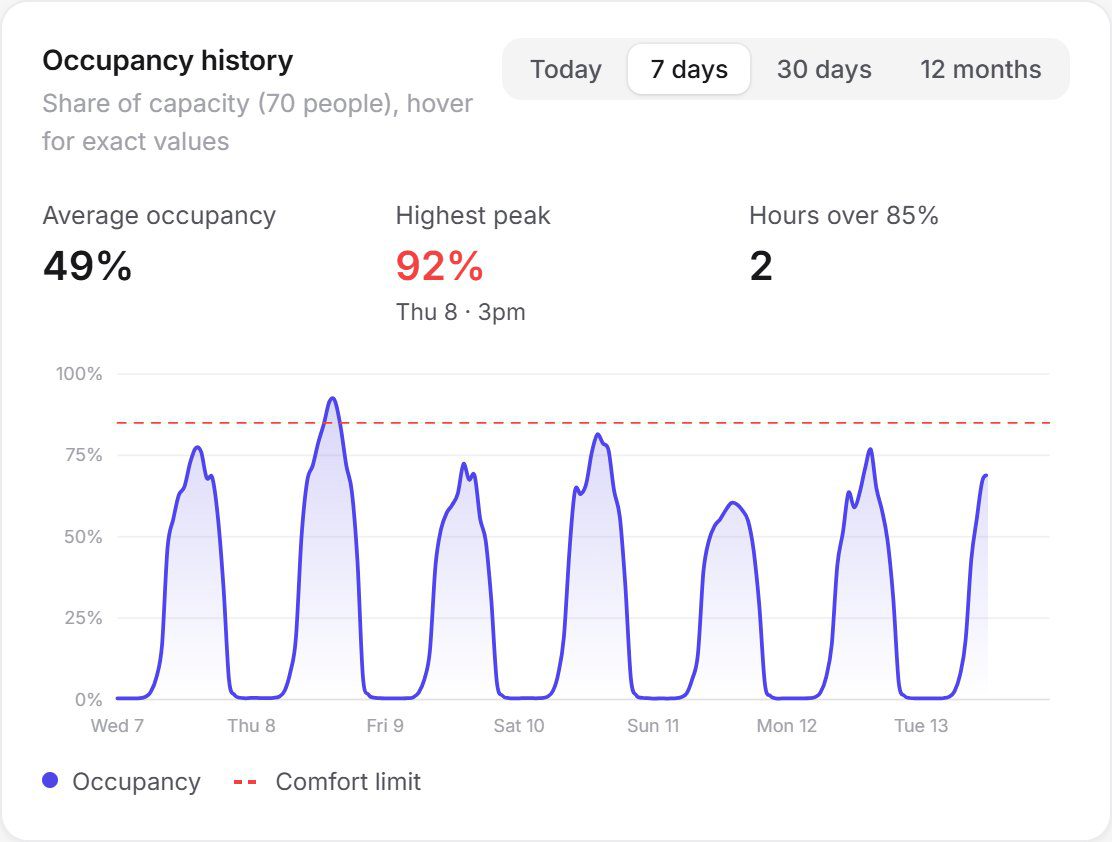
Occupancy history over a week
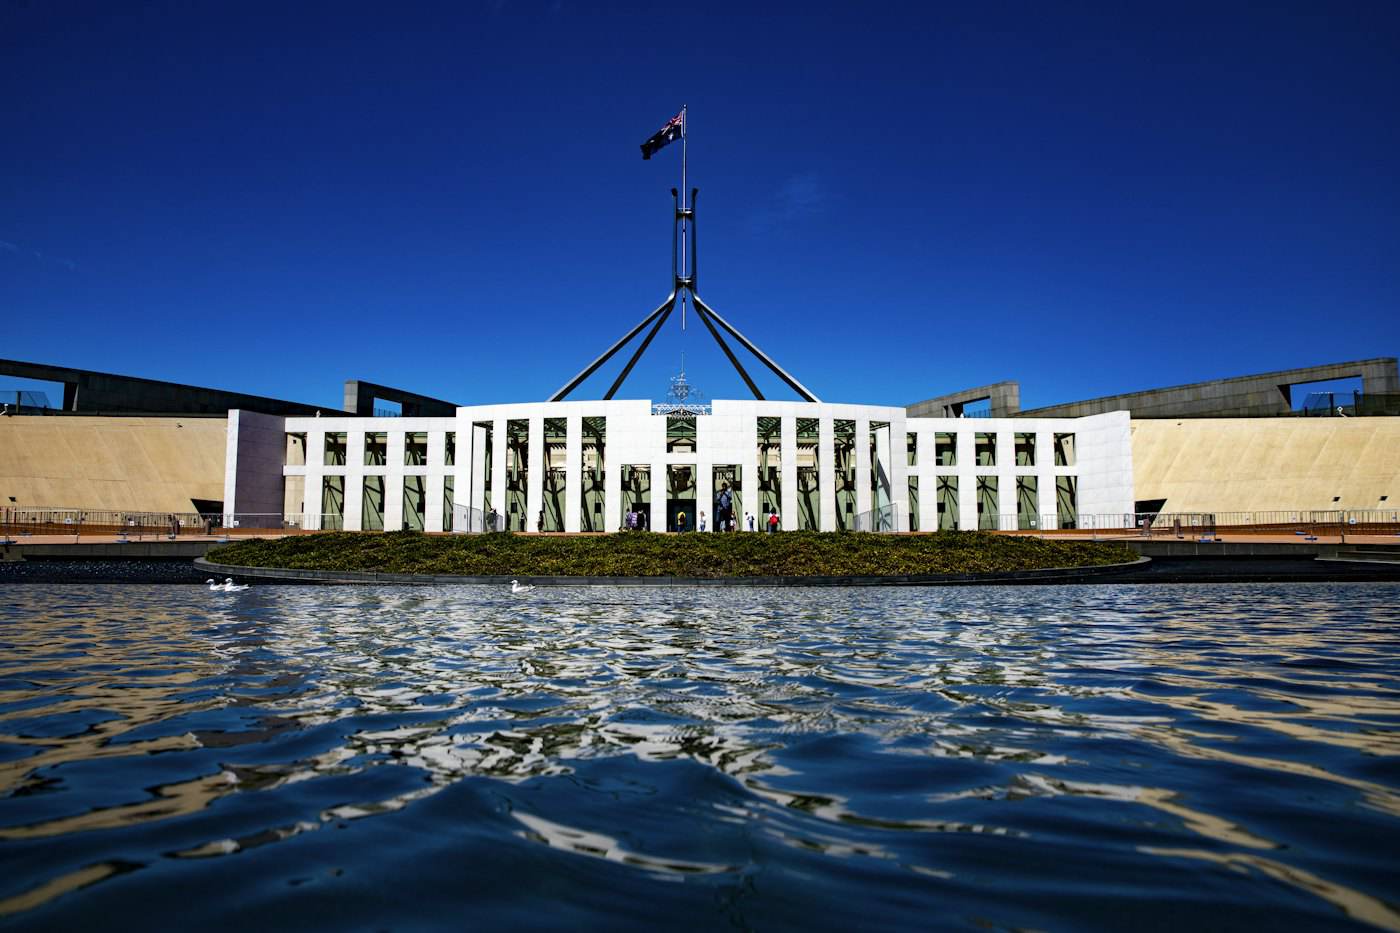
Parliament House, Canberra

Right-size the property portfolio.

Hybrid work changed how offices are used. See occupancy across every floor and site, and consolidate with confidence.

  • Portfolio rationalisation. Compare utilisation across buildings and identify consolidation opportunities.
  • Workplace strategy. Understand team attendance patterns by day and floor.
  • Safety and compliance. Evacuation counts and capacity monitoring for public-facing sites.
  • Transparent reporting. Executive packs ready for ministers, boards and audit.

Place Performance for government

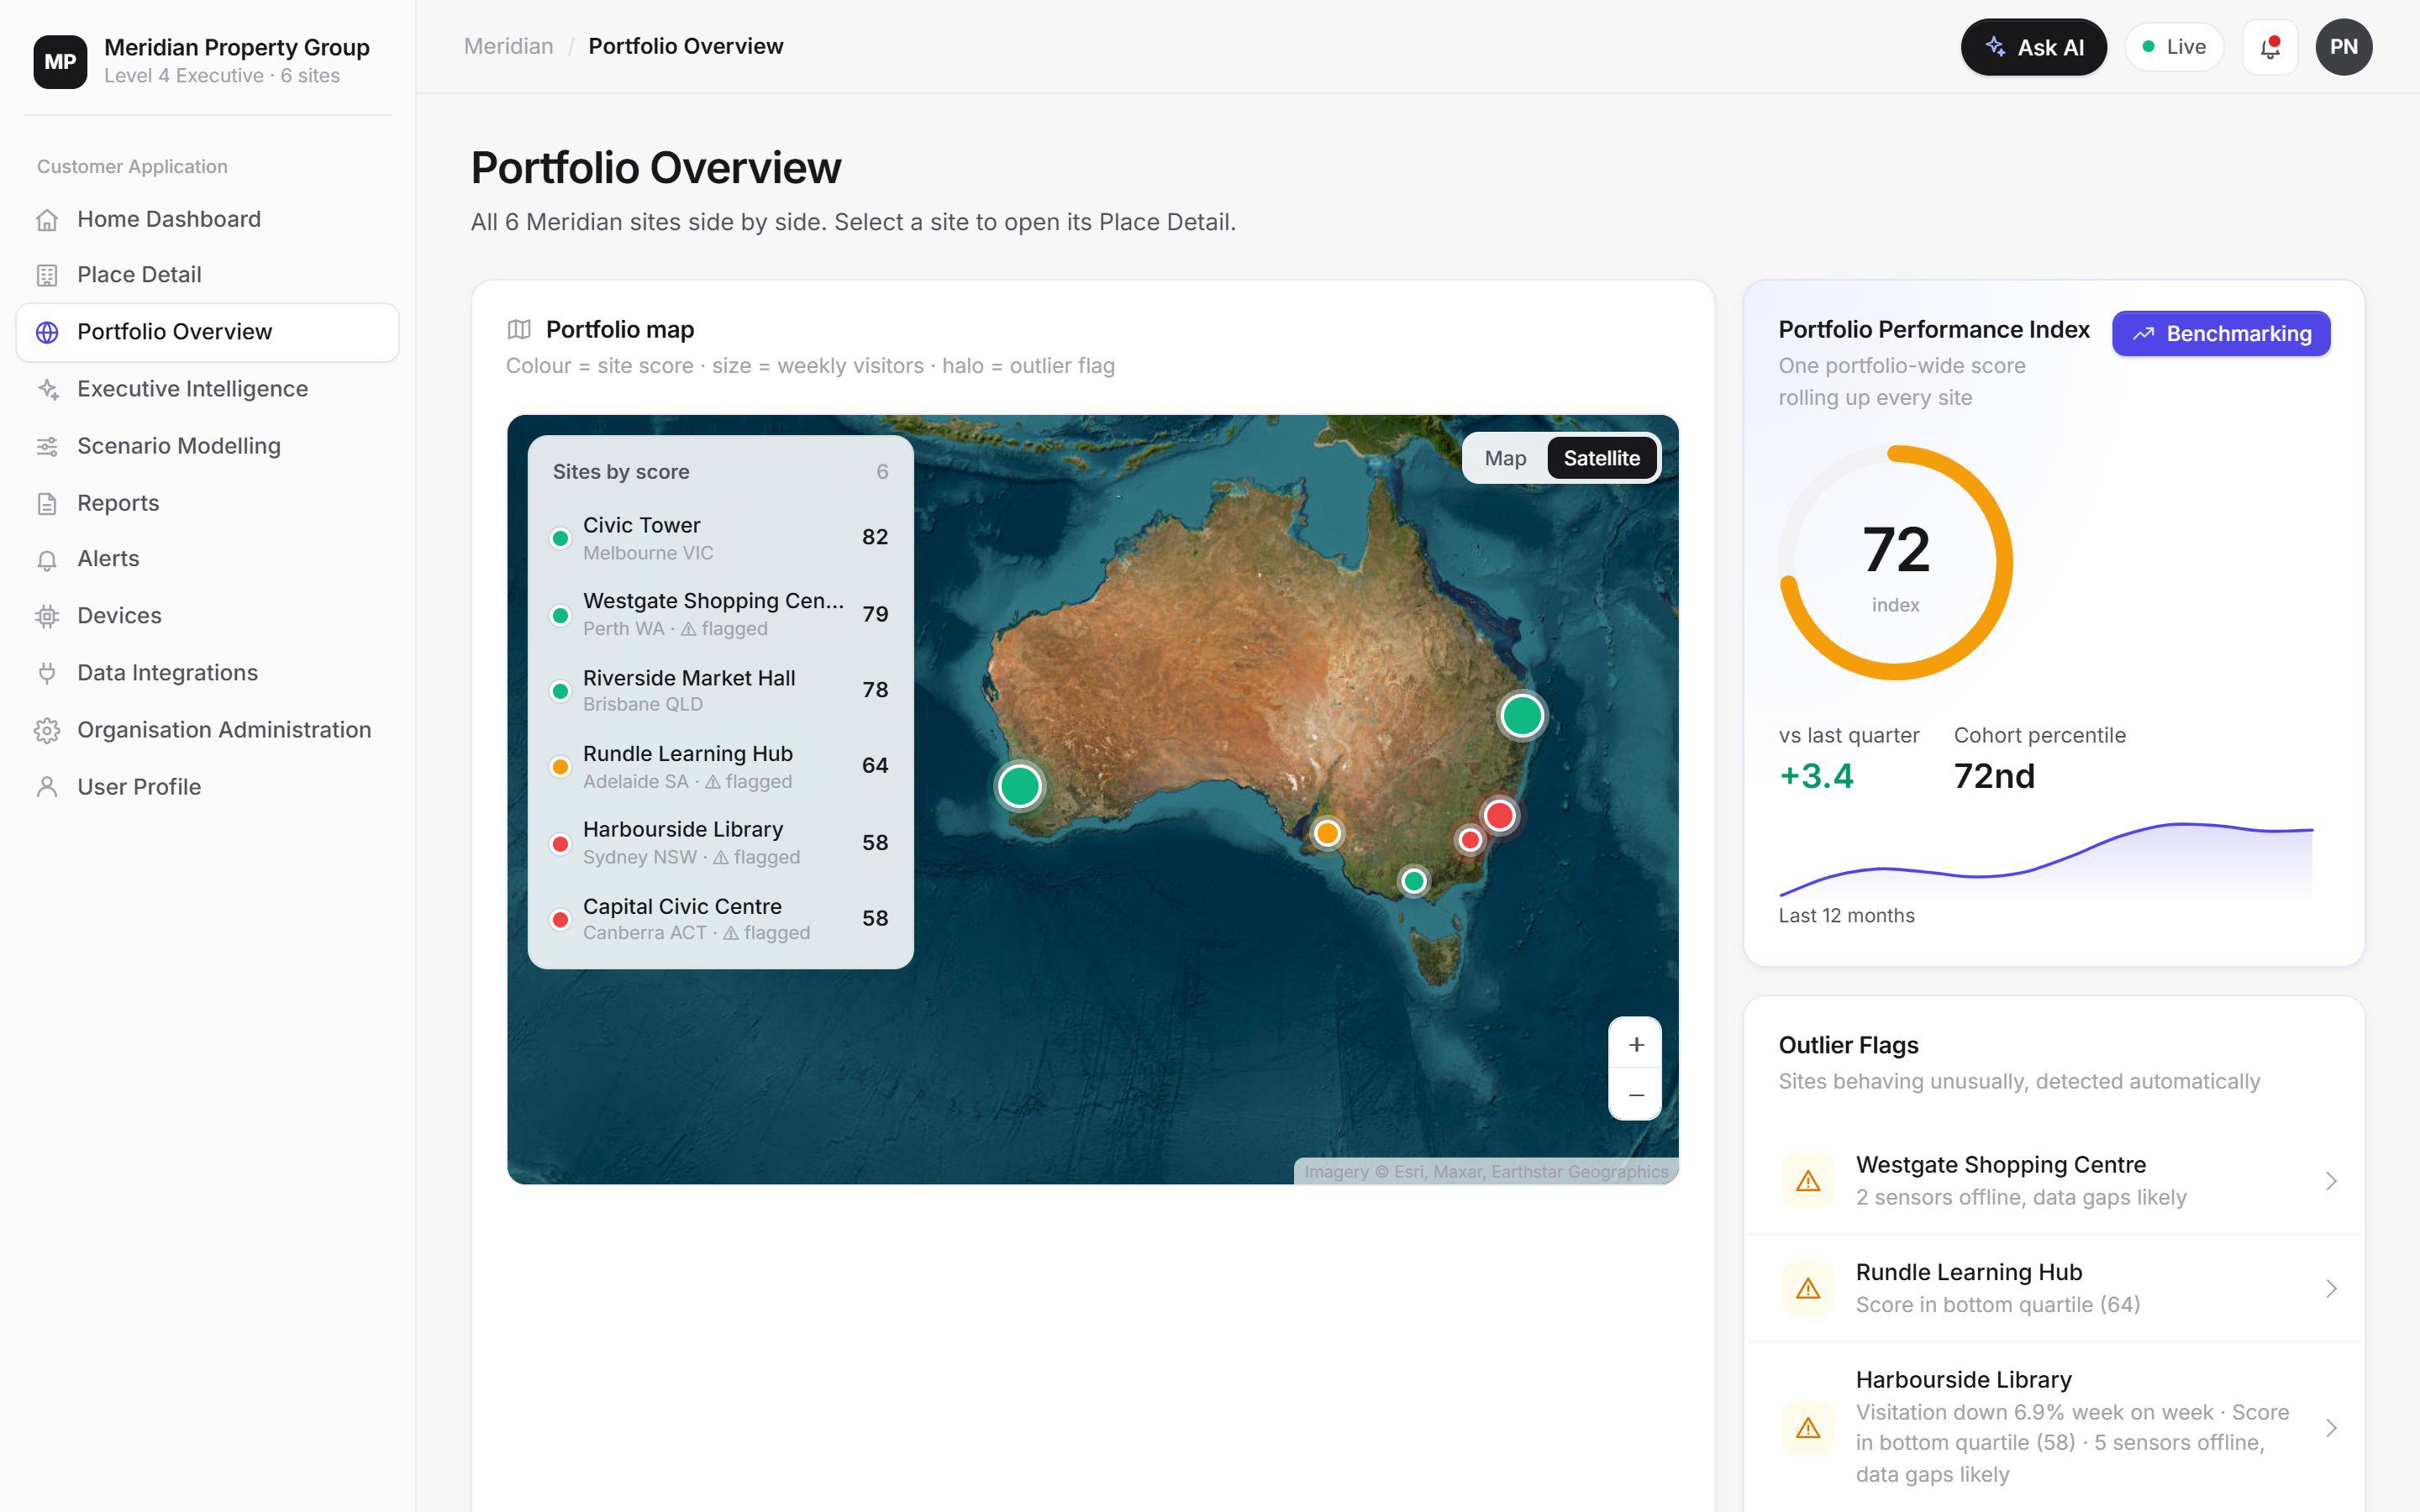
Portfolio overview with site ranking
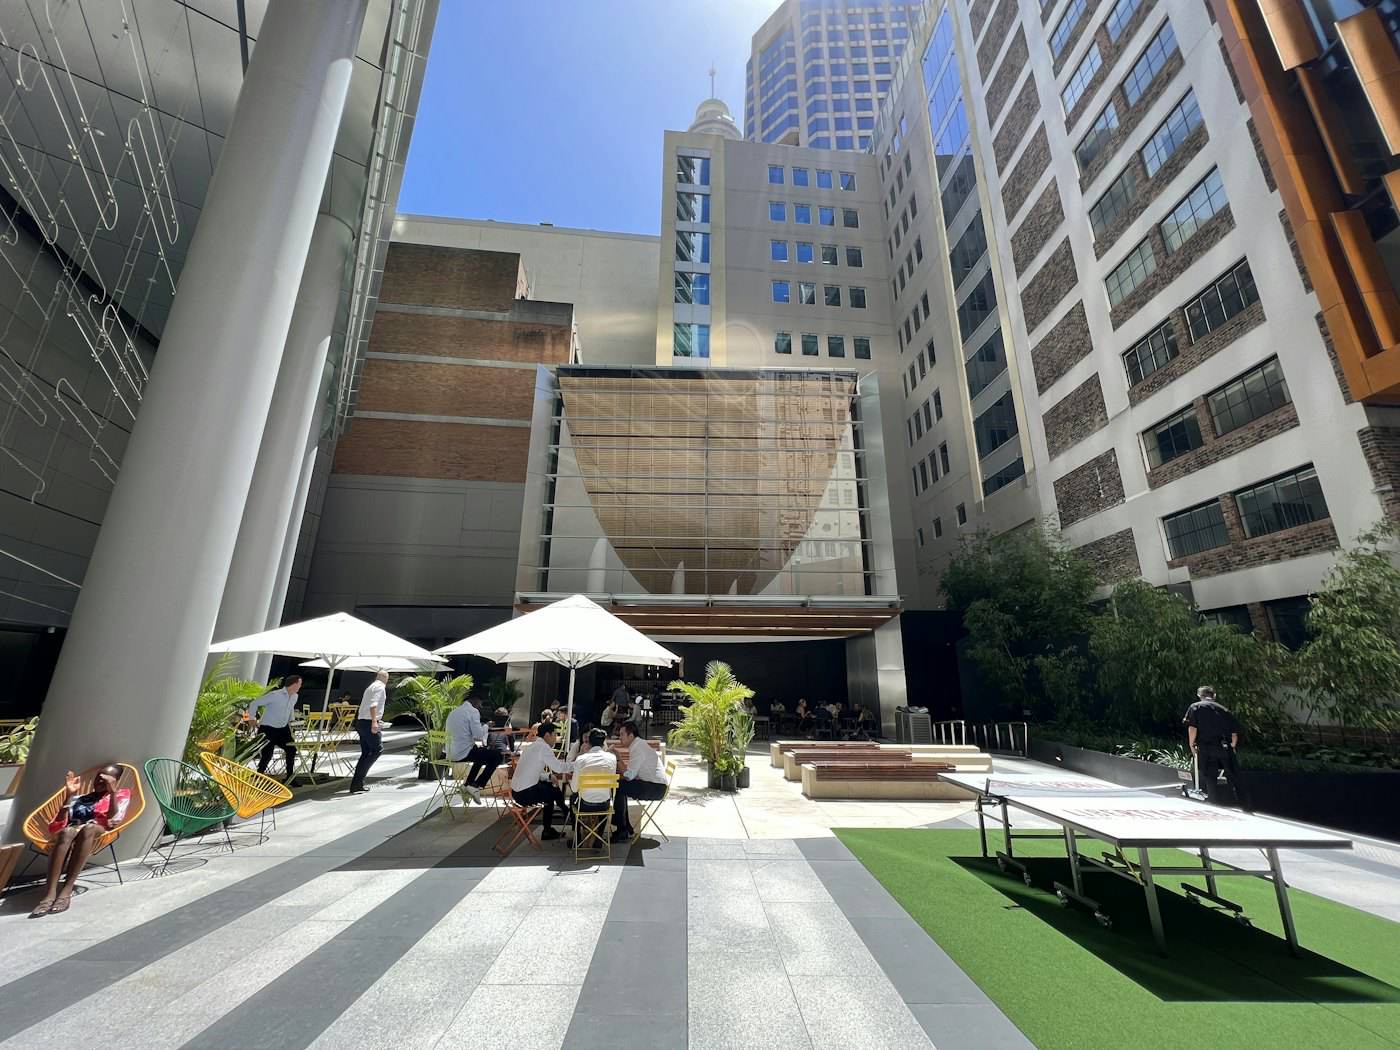
Office tower courtyard in the Sydney CBD

Run buildings on demand, not on schedule.

Clean, cool and staff spaces when people are actually there, and give tenants the data to love their workplace.

  • Demand-based cleaning. Trigger cleans after a set number of visits, not fixed times.
  • Energy and HVAC. Feed occupancy into your BMS and stop conditioning empty floors.
  • Tenant insights. Show tenants how their space performs and support lease decisions.
  • Asset value. Prove the impact of refits with before-and-after analysis.

Place Performance for buildings & property

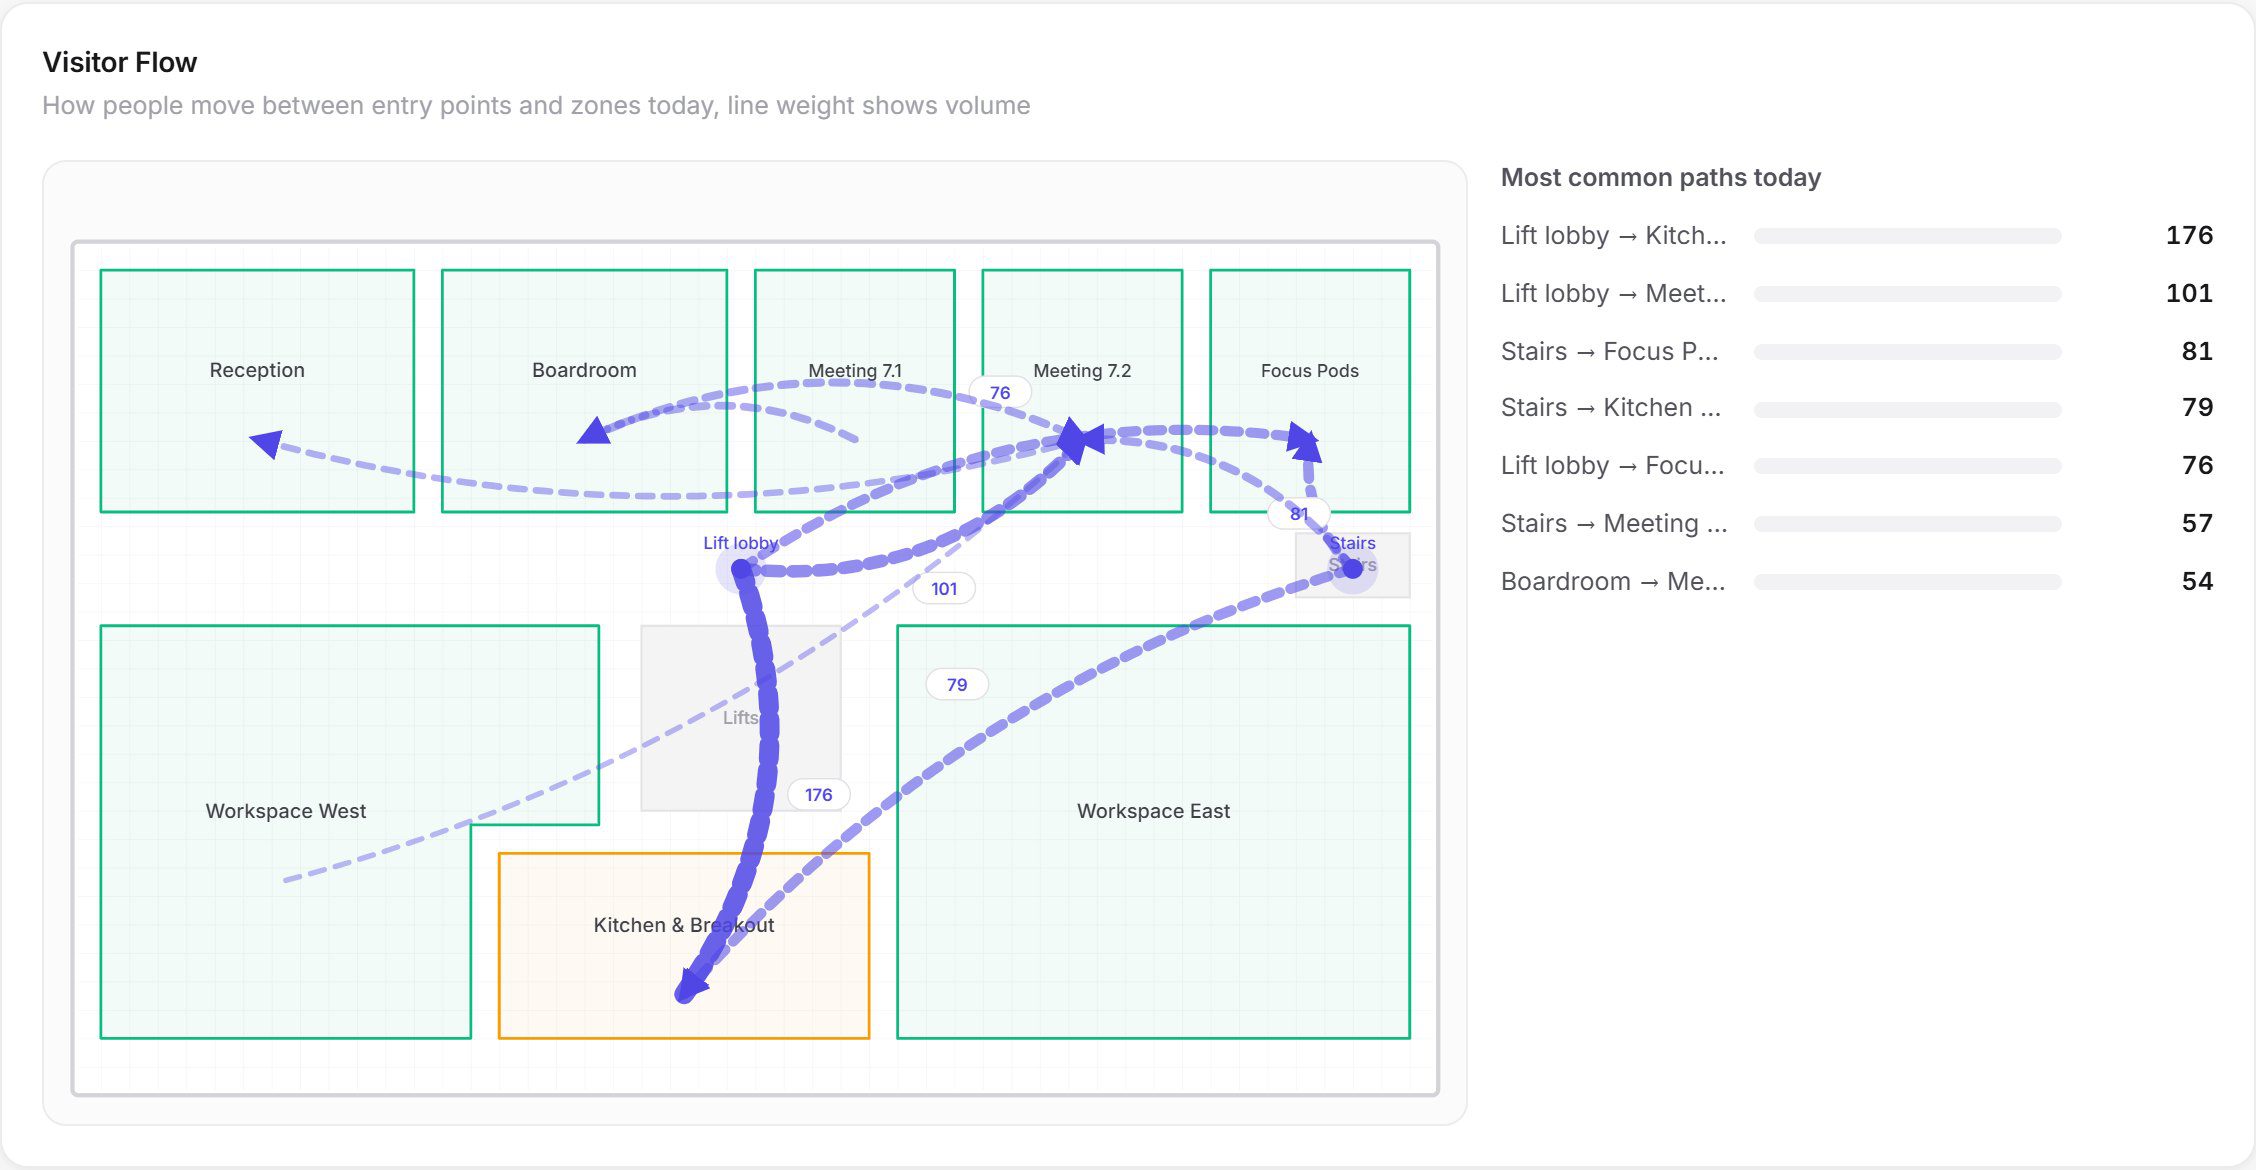
Visitor flow across a floor
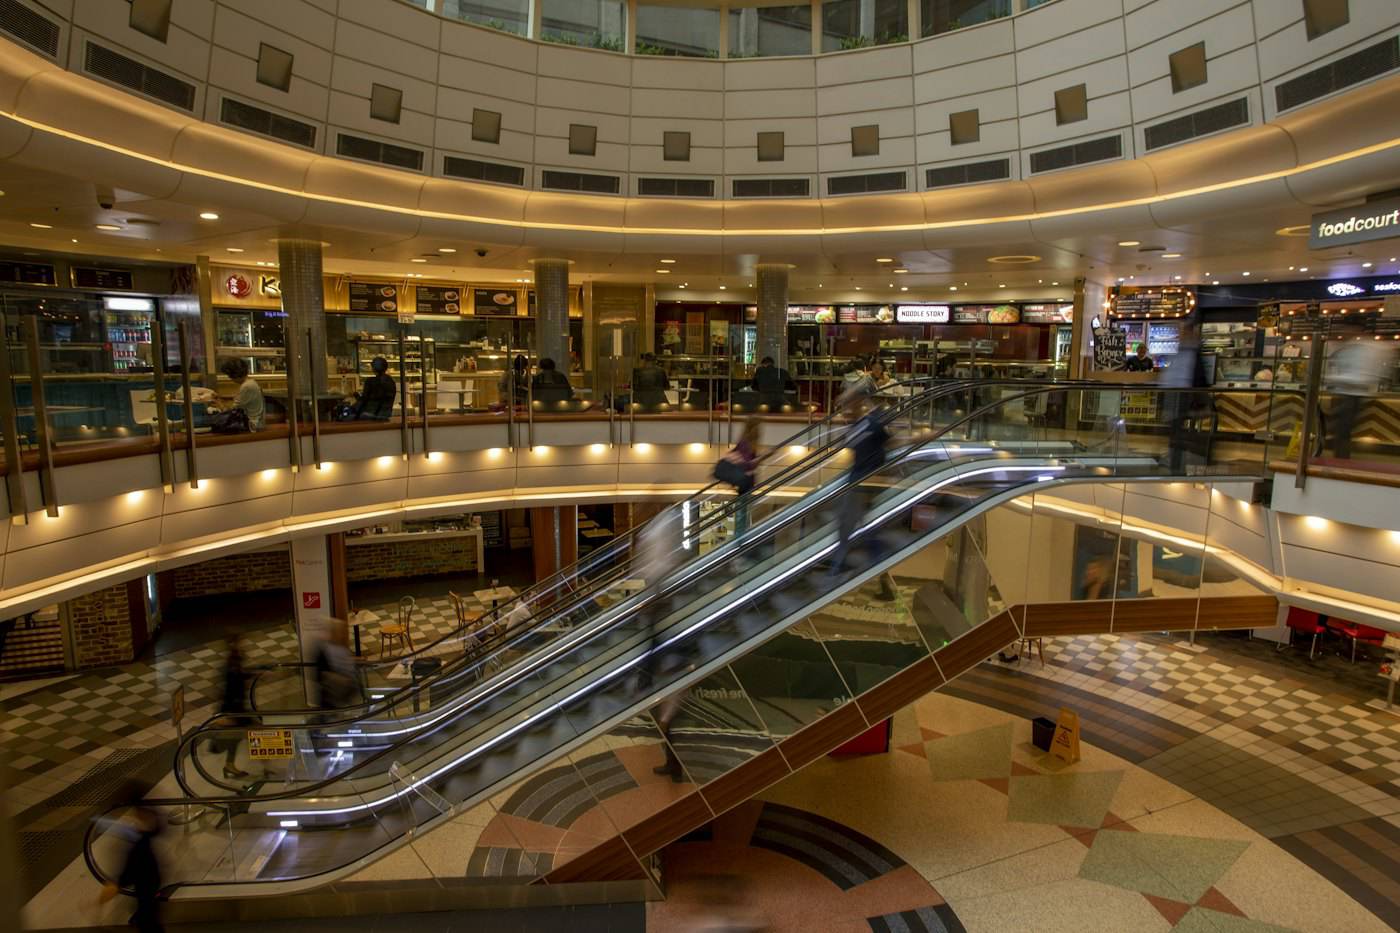
Shopping centre atrium in Sydney

Turn footfall into performance.

Connect visitation to sales and see which zones, tenants and events really drive results.

  • Conversion. Combine footfall with point-of-sale data to see sales per visitor.
  • Peak management. Staff and clean for the busiest hours of each day.
  • Tenant and zone ranking. Find your strongest and weakest areas.
  • Event impact. Measure the uplift from promotions and activations.

Place Performance for retail & precincts

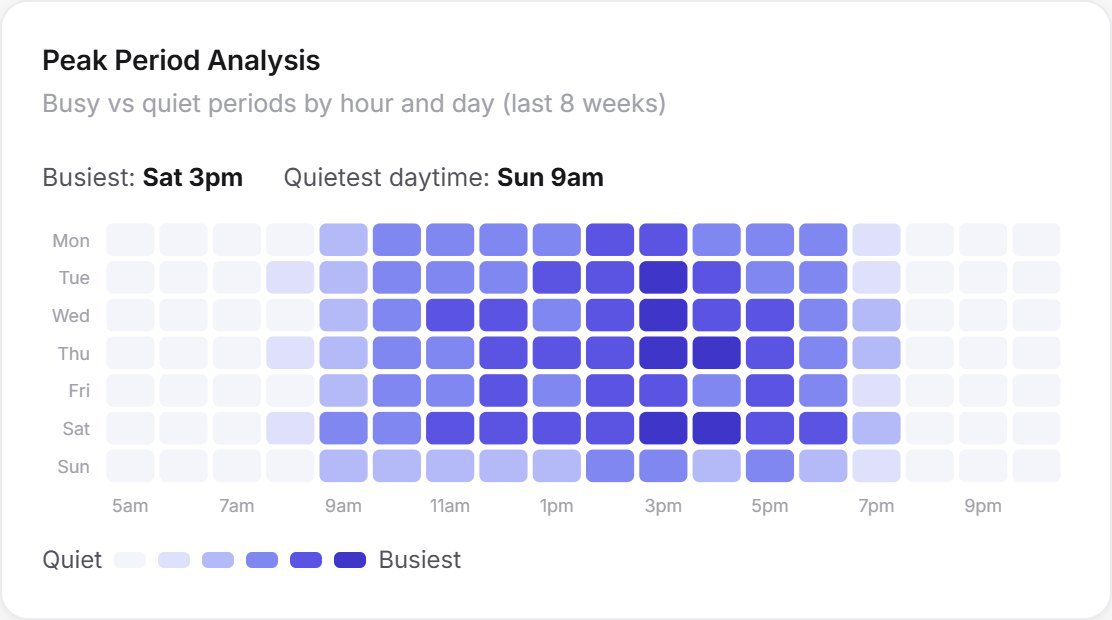
Peak period heat grid
People on a harbourside lawn in Sydney

Measure the public realm, not just buildings.

Pedestrians, cyclists and vehicles across parks, trails, foreshores, plazas and streets, permanent or for a single event.

  • Active transport. Cyclist and pedestrian volumes and direction on shared paths and trails.
  • Streets and access points. Vehicle movement across roads, car parks and precinct entries.
  • Before and after. Measure how places change during and after infrastructure projects.
  • Events. Temporary counting for attendance, entry flow and crowd safety.

Place Performance for parks, trails & streets

Activity trend over a week

The platform

Everything you need to measure, understand and act.

01

Every site, space and zone in one view

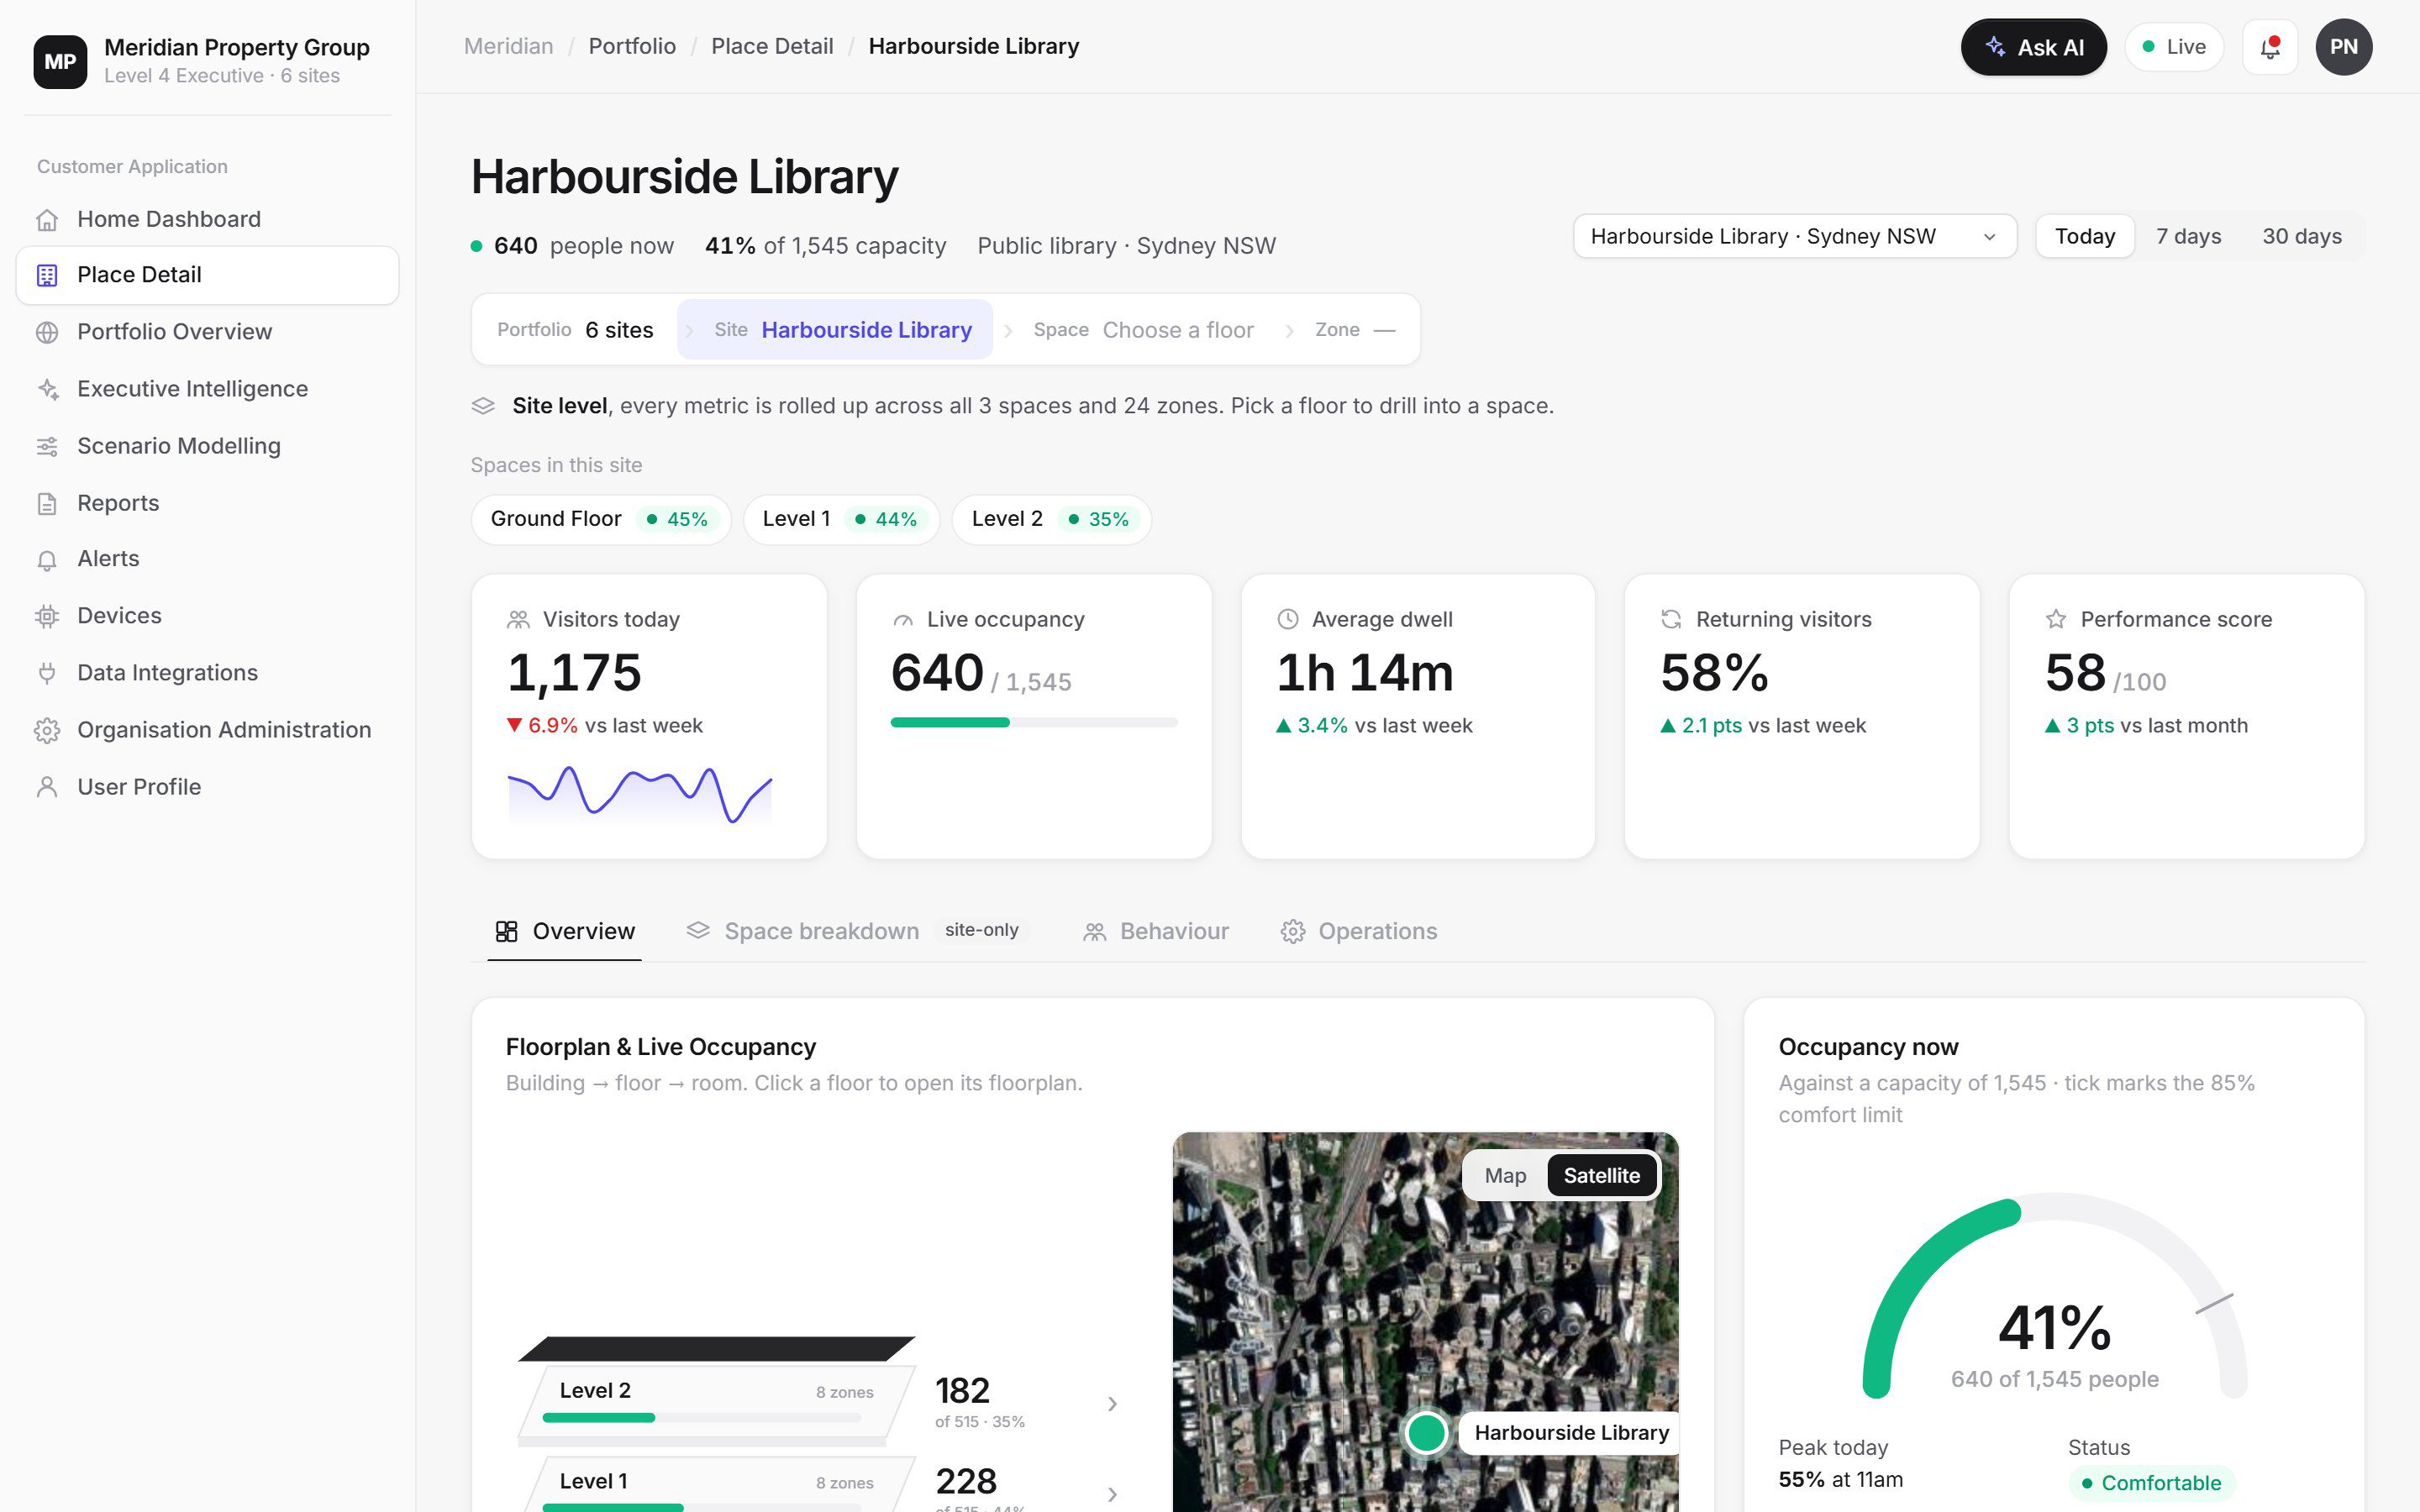
Start at your whole portfolio, then drill into a building, a floor and a single room. Every metric rolls up and down automatically: visitors, occupancy, dwell, peak times, repeat visits and demographics.

See it in the live demo
Site level place detail
02

Reporting that runs itself

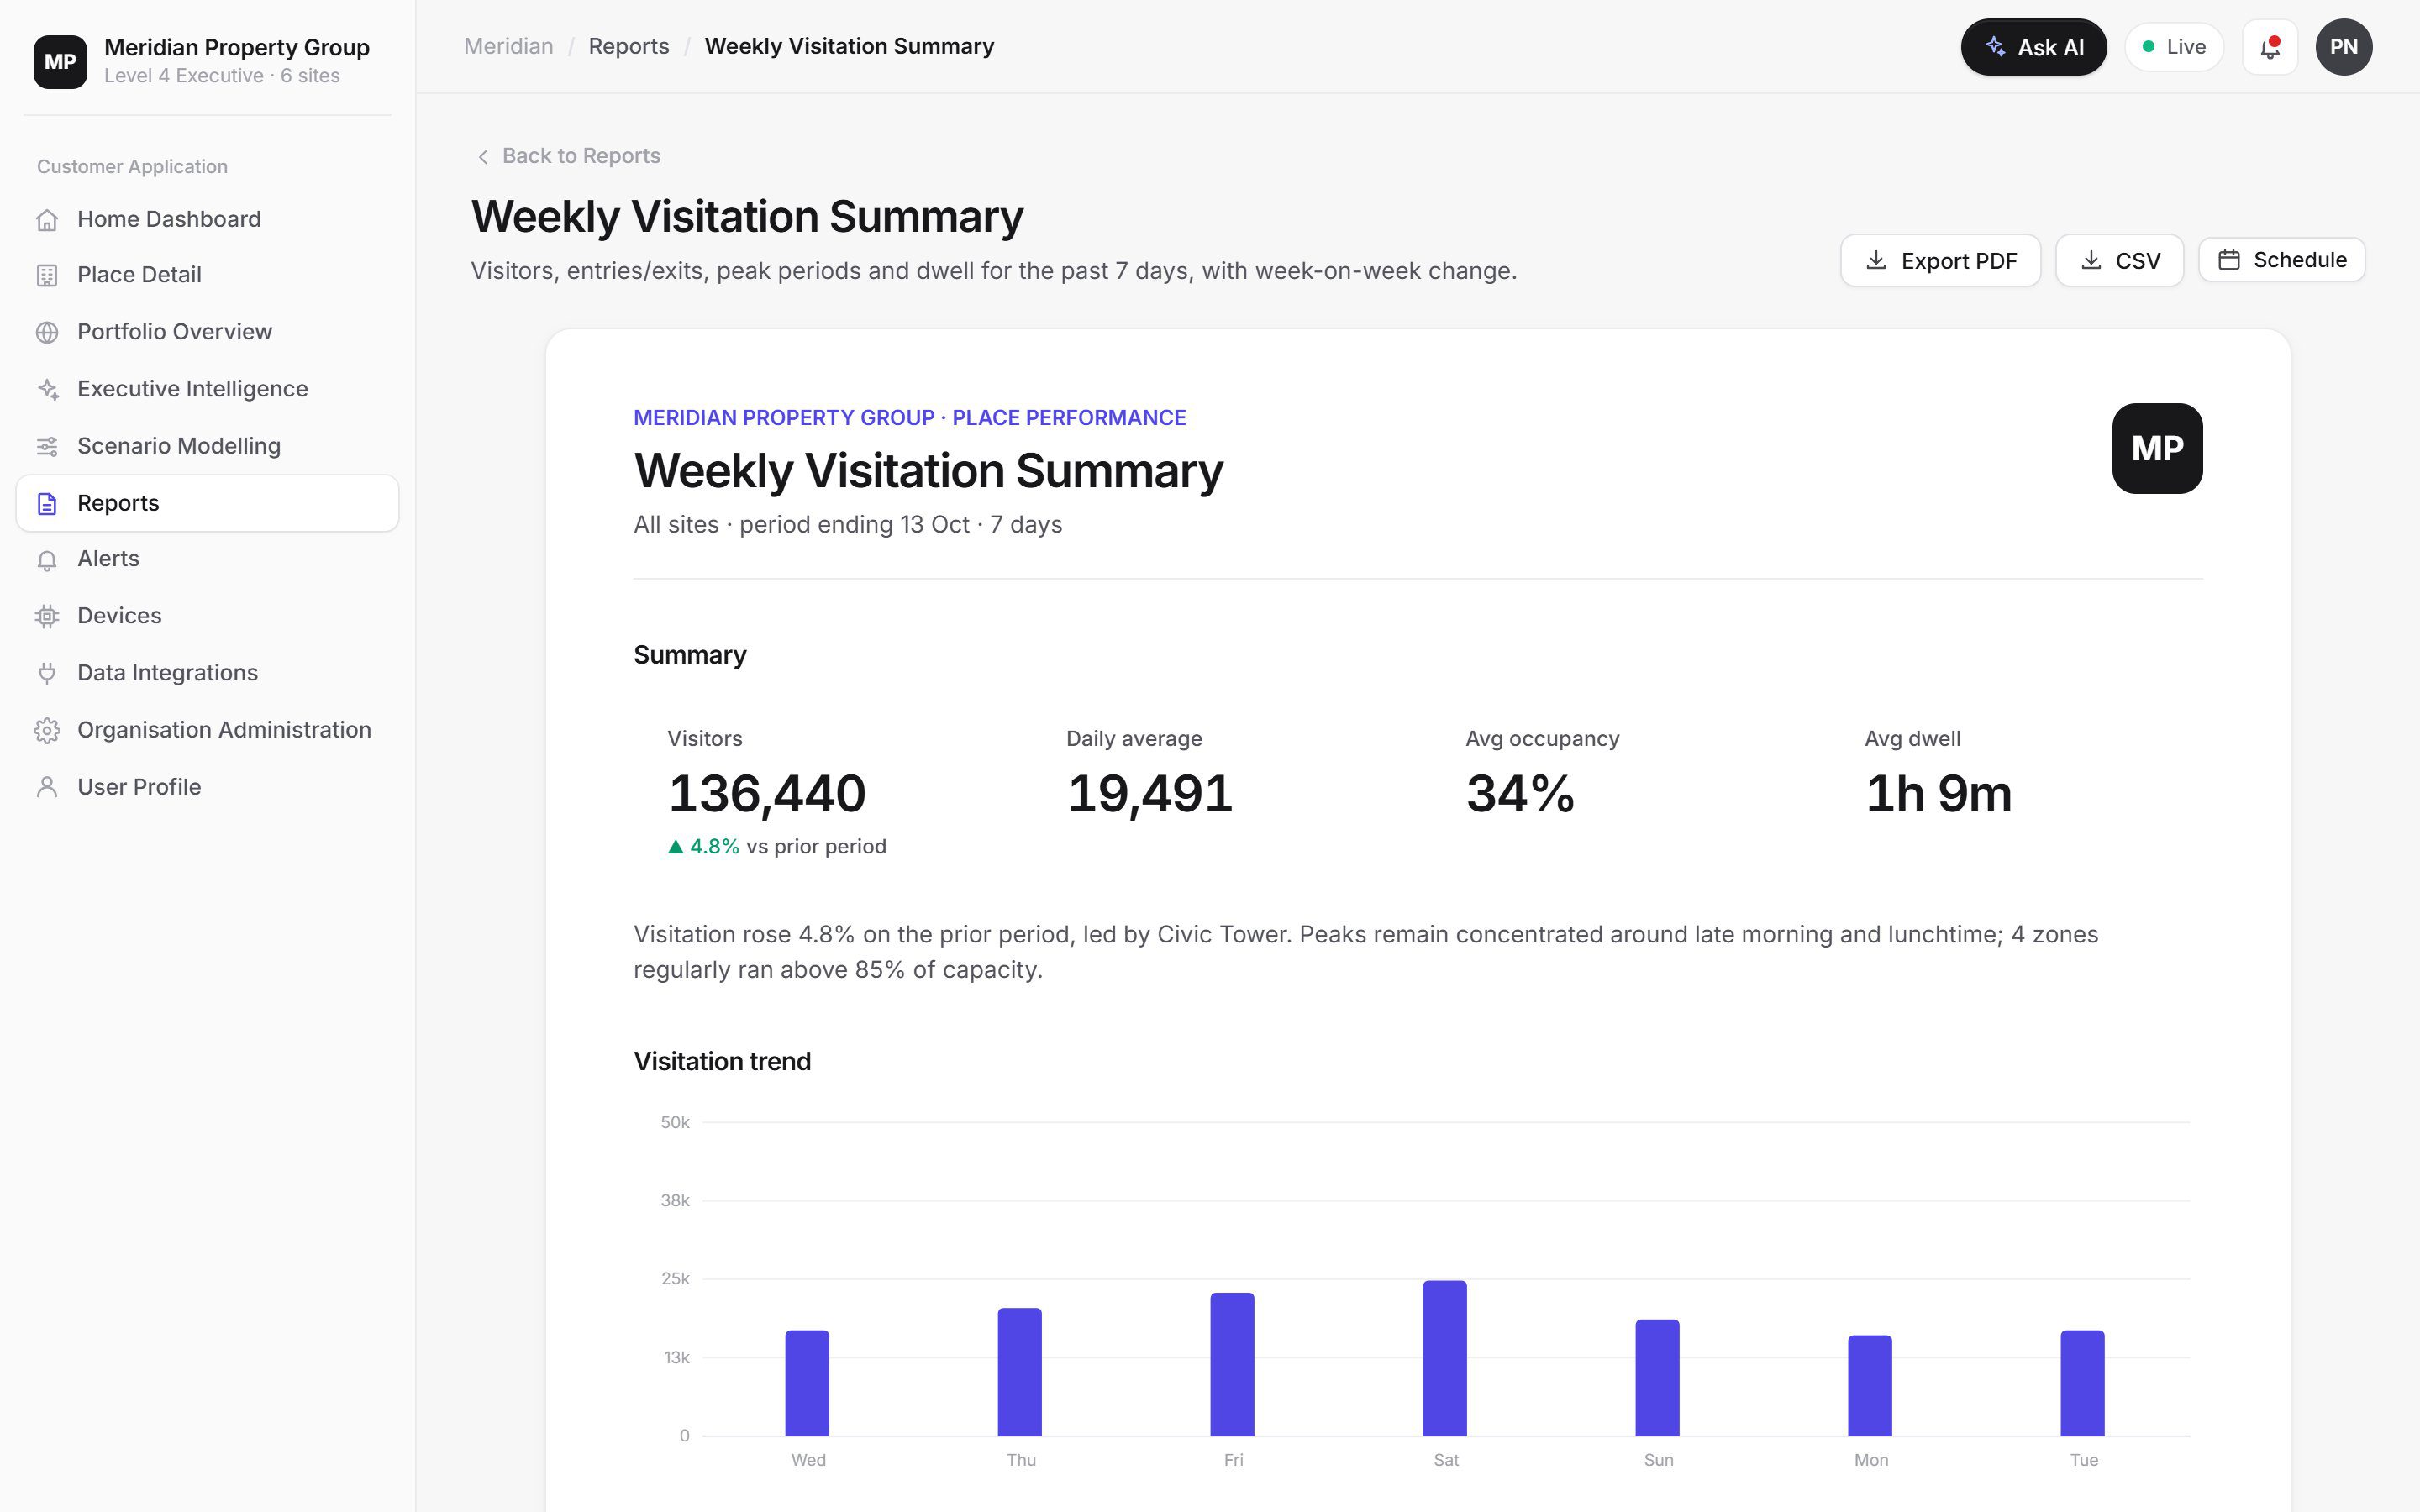
Weekly visitation summaries, monthly capacity reports and device health, scheduled to the right inboxes. Board-ready executive packs generate themselves each quarter.

Open a sample report
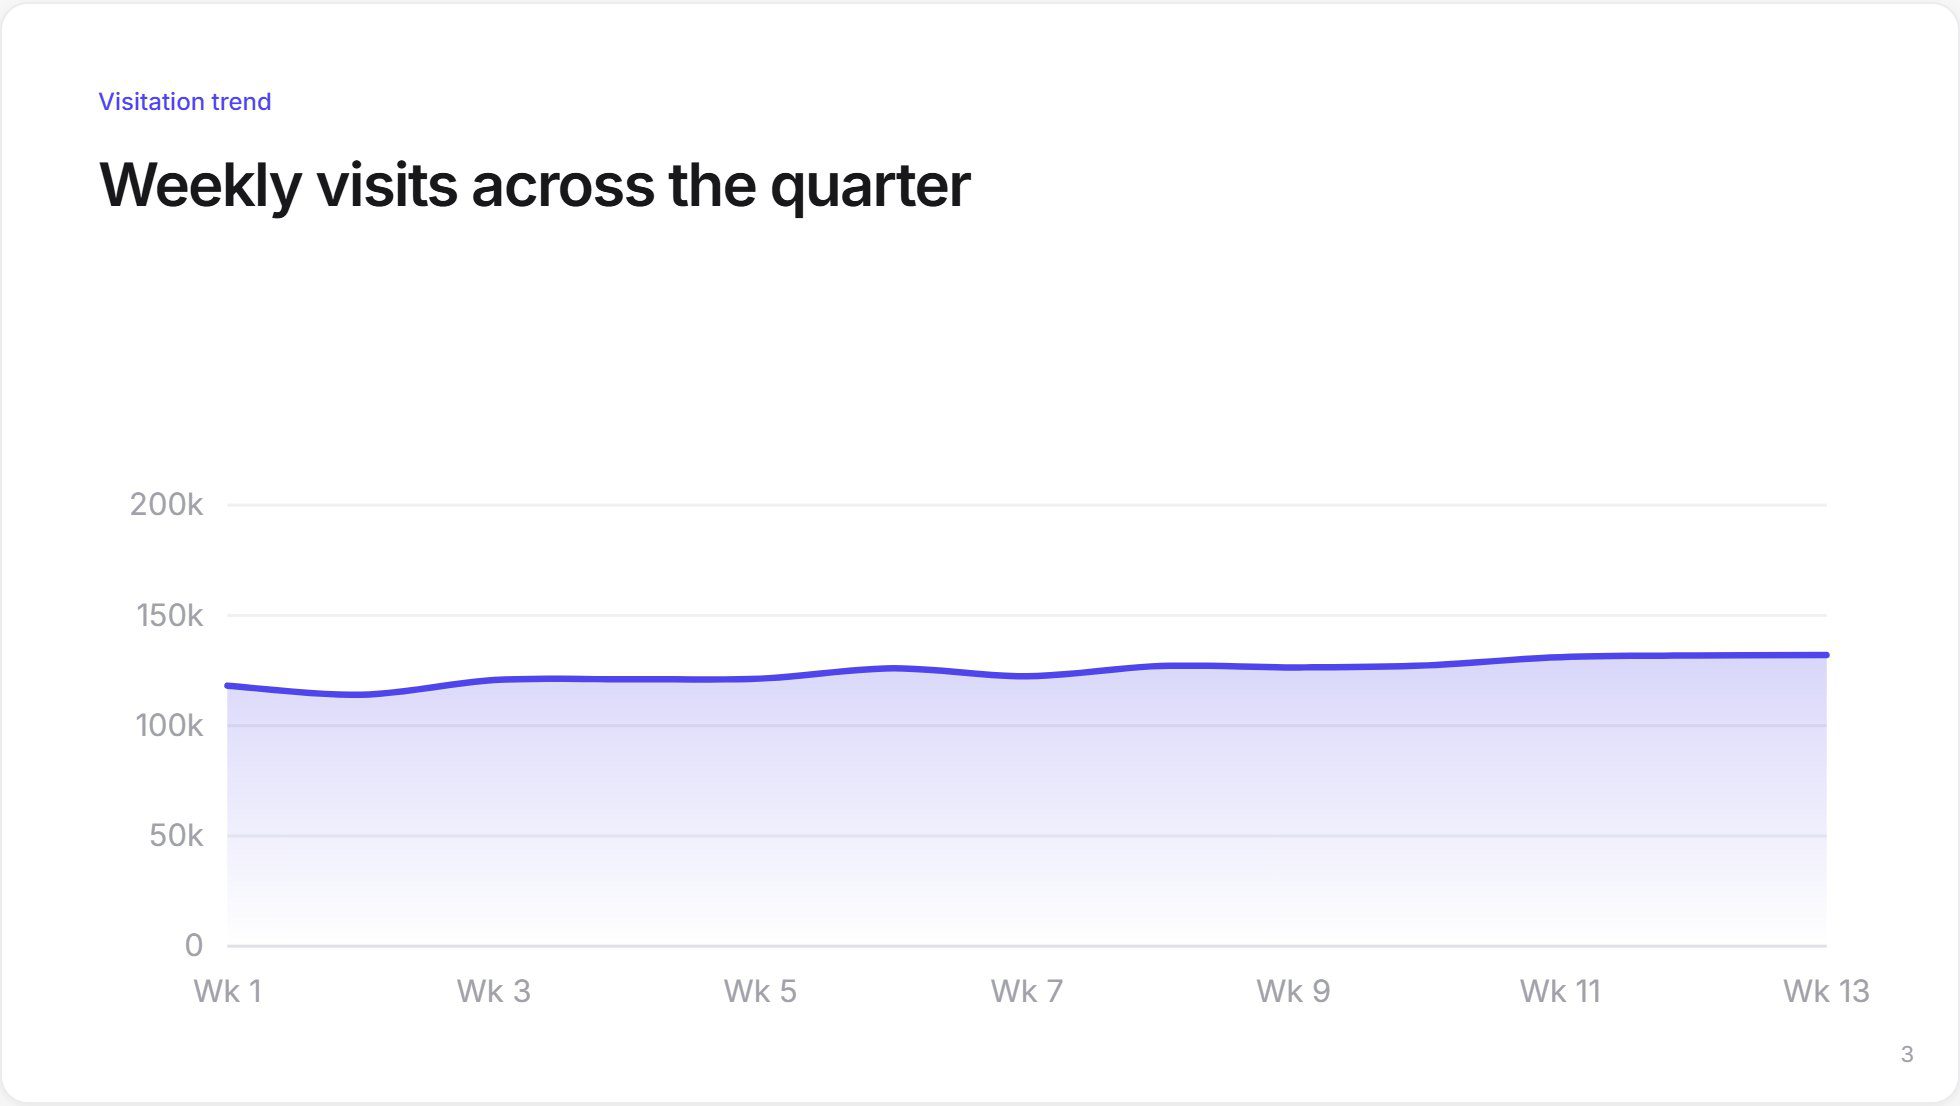
Weekly visitation report
Executive board pack slide
03

Device health you can trust

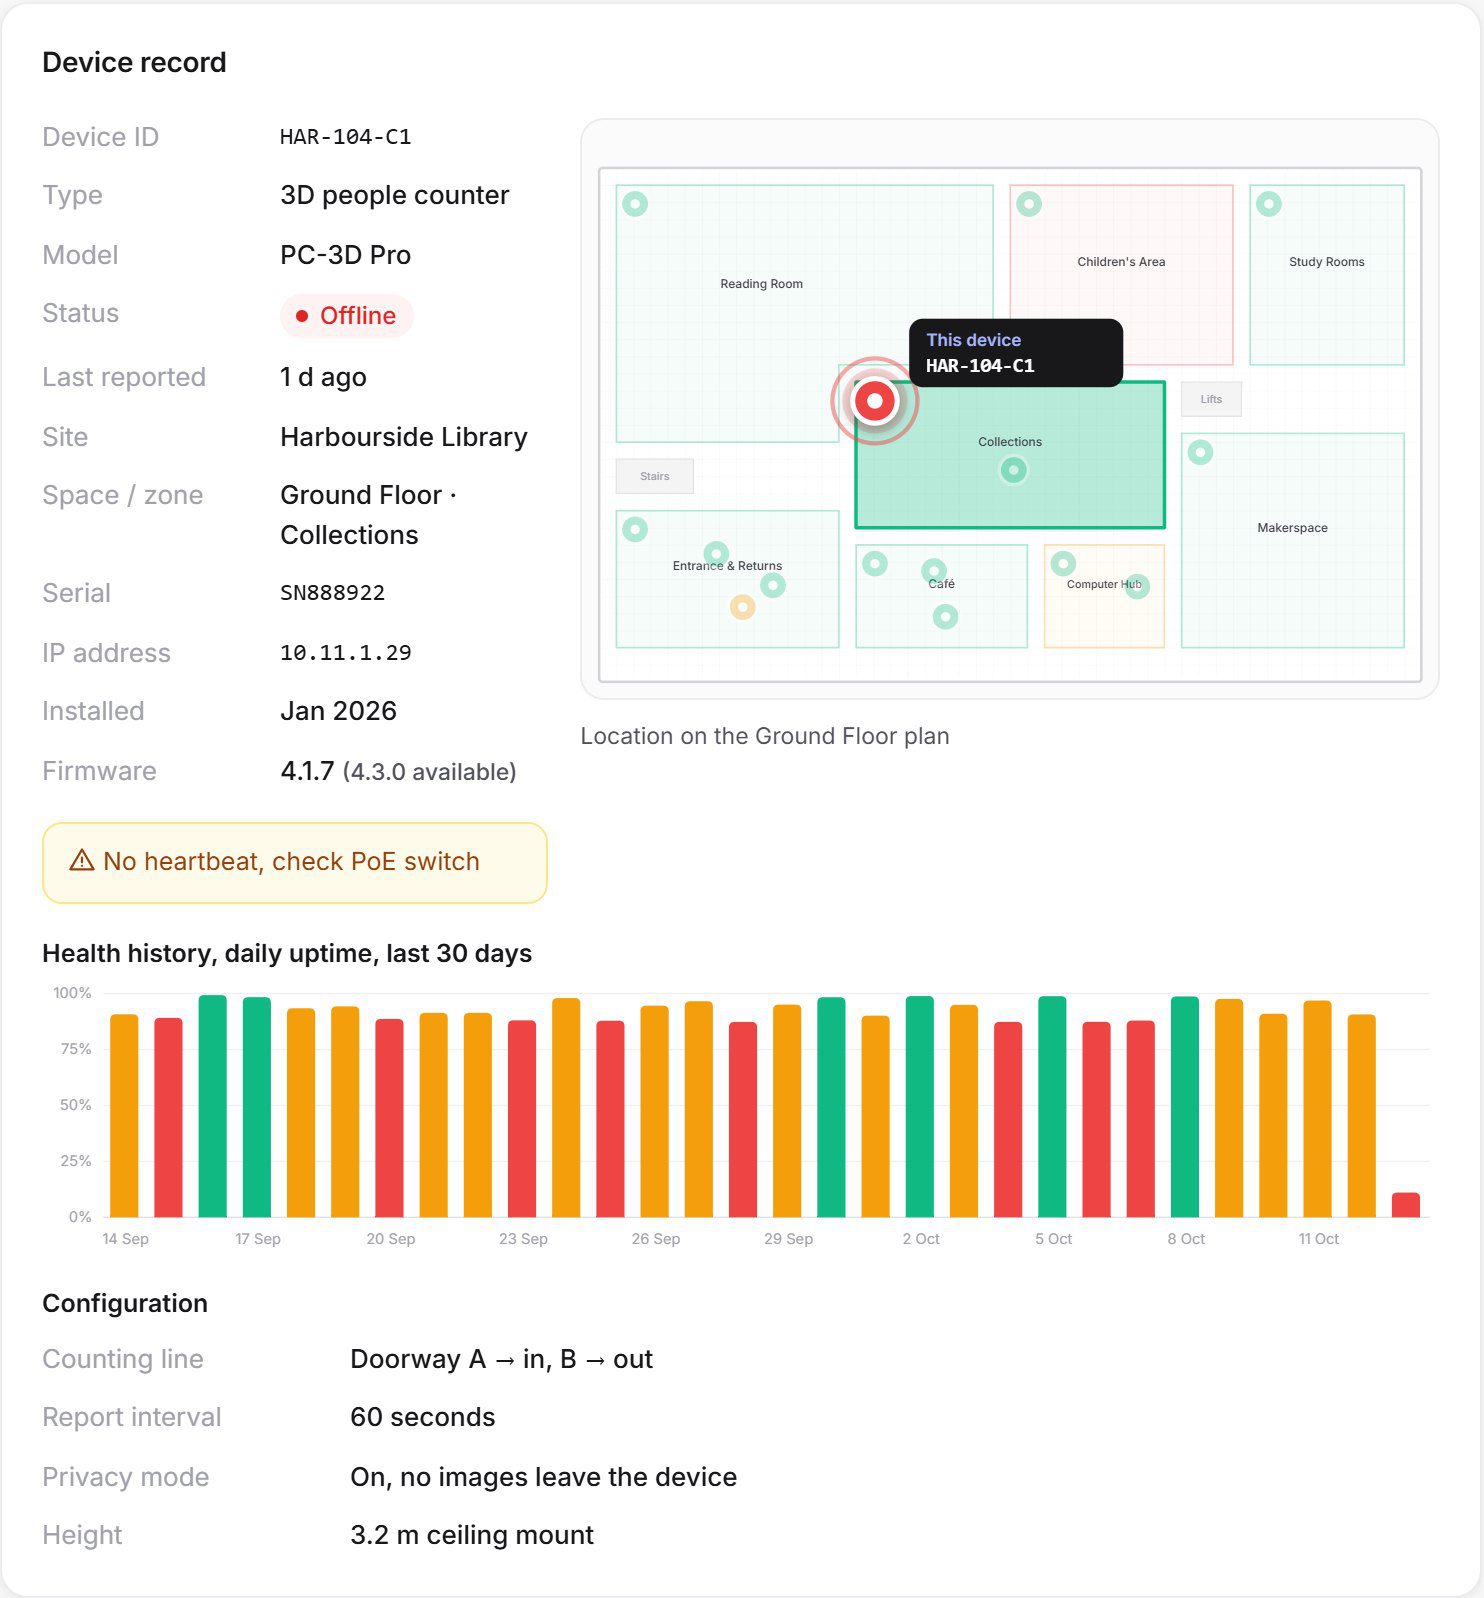
See every sensor on your floorplans with its live status. When a device goes offline you're alerted, and our team is already on it.

View devices
Device record with location on floorplan

AI, predictions & planning

Don't just see what happened. Know what's next.

Place Performance learns the rhythm of every place to forecast demand, flag risks and recommend actions, then lets you test changes before you make them.

Explore AI & forecasting

Ask your buildings anything

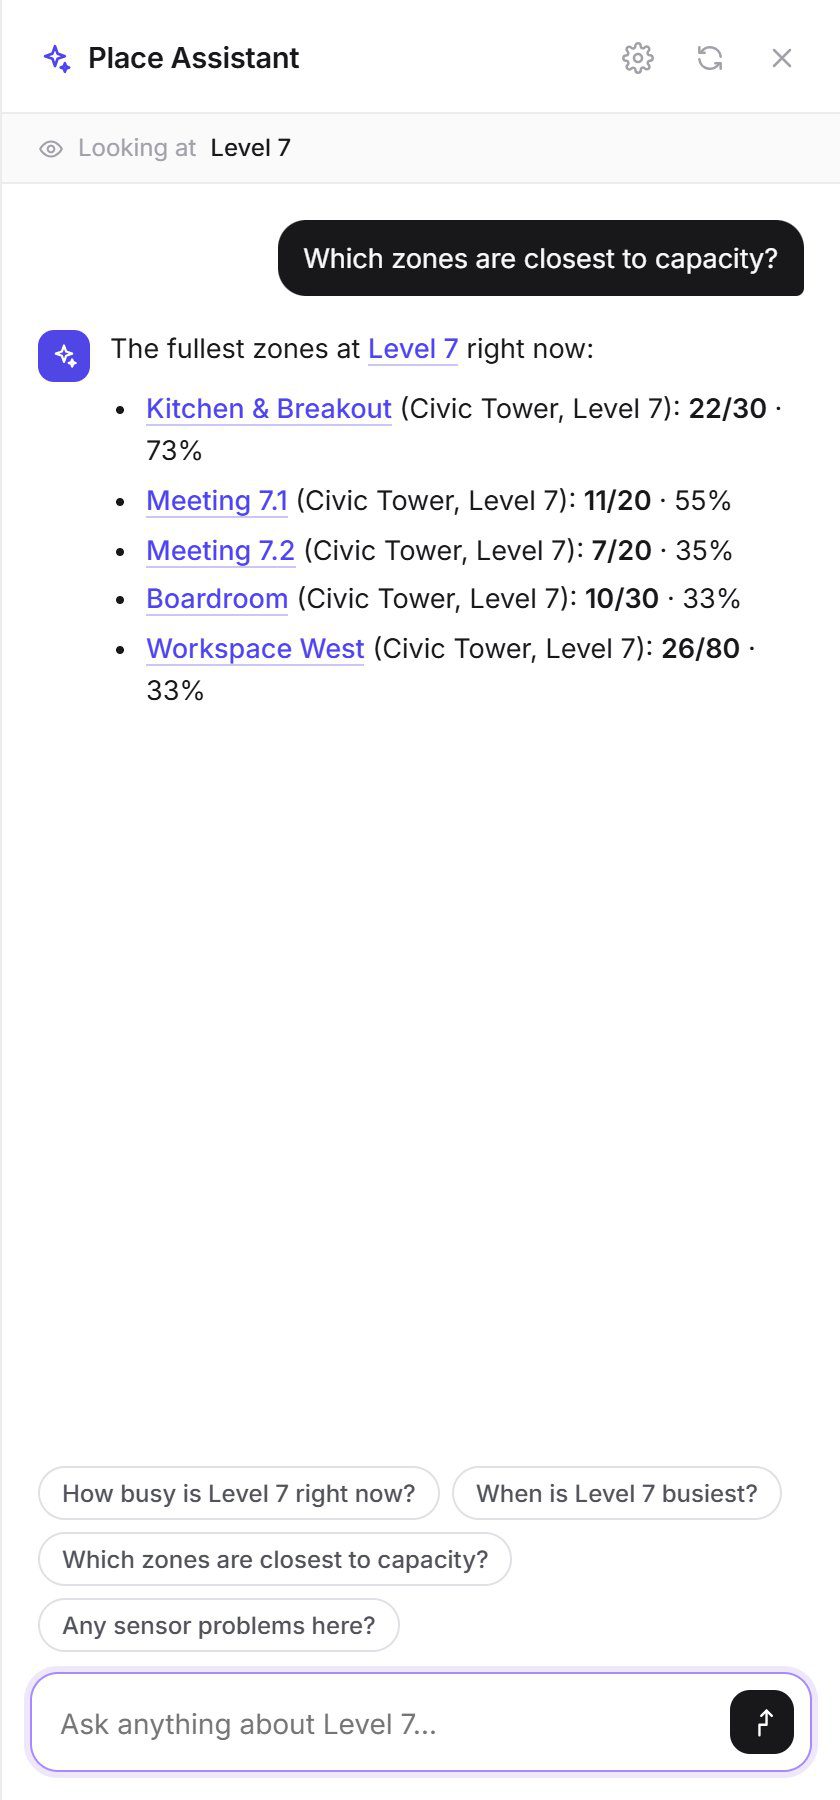
The Place Assistant answers questions in plain English using your live data. "Which rooms are over capacity?" "When is the library busiest?" "What should we focus on this week?"

Which zones are closest to capacity?
Place Assistant answering a question

Forecasting

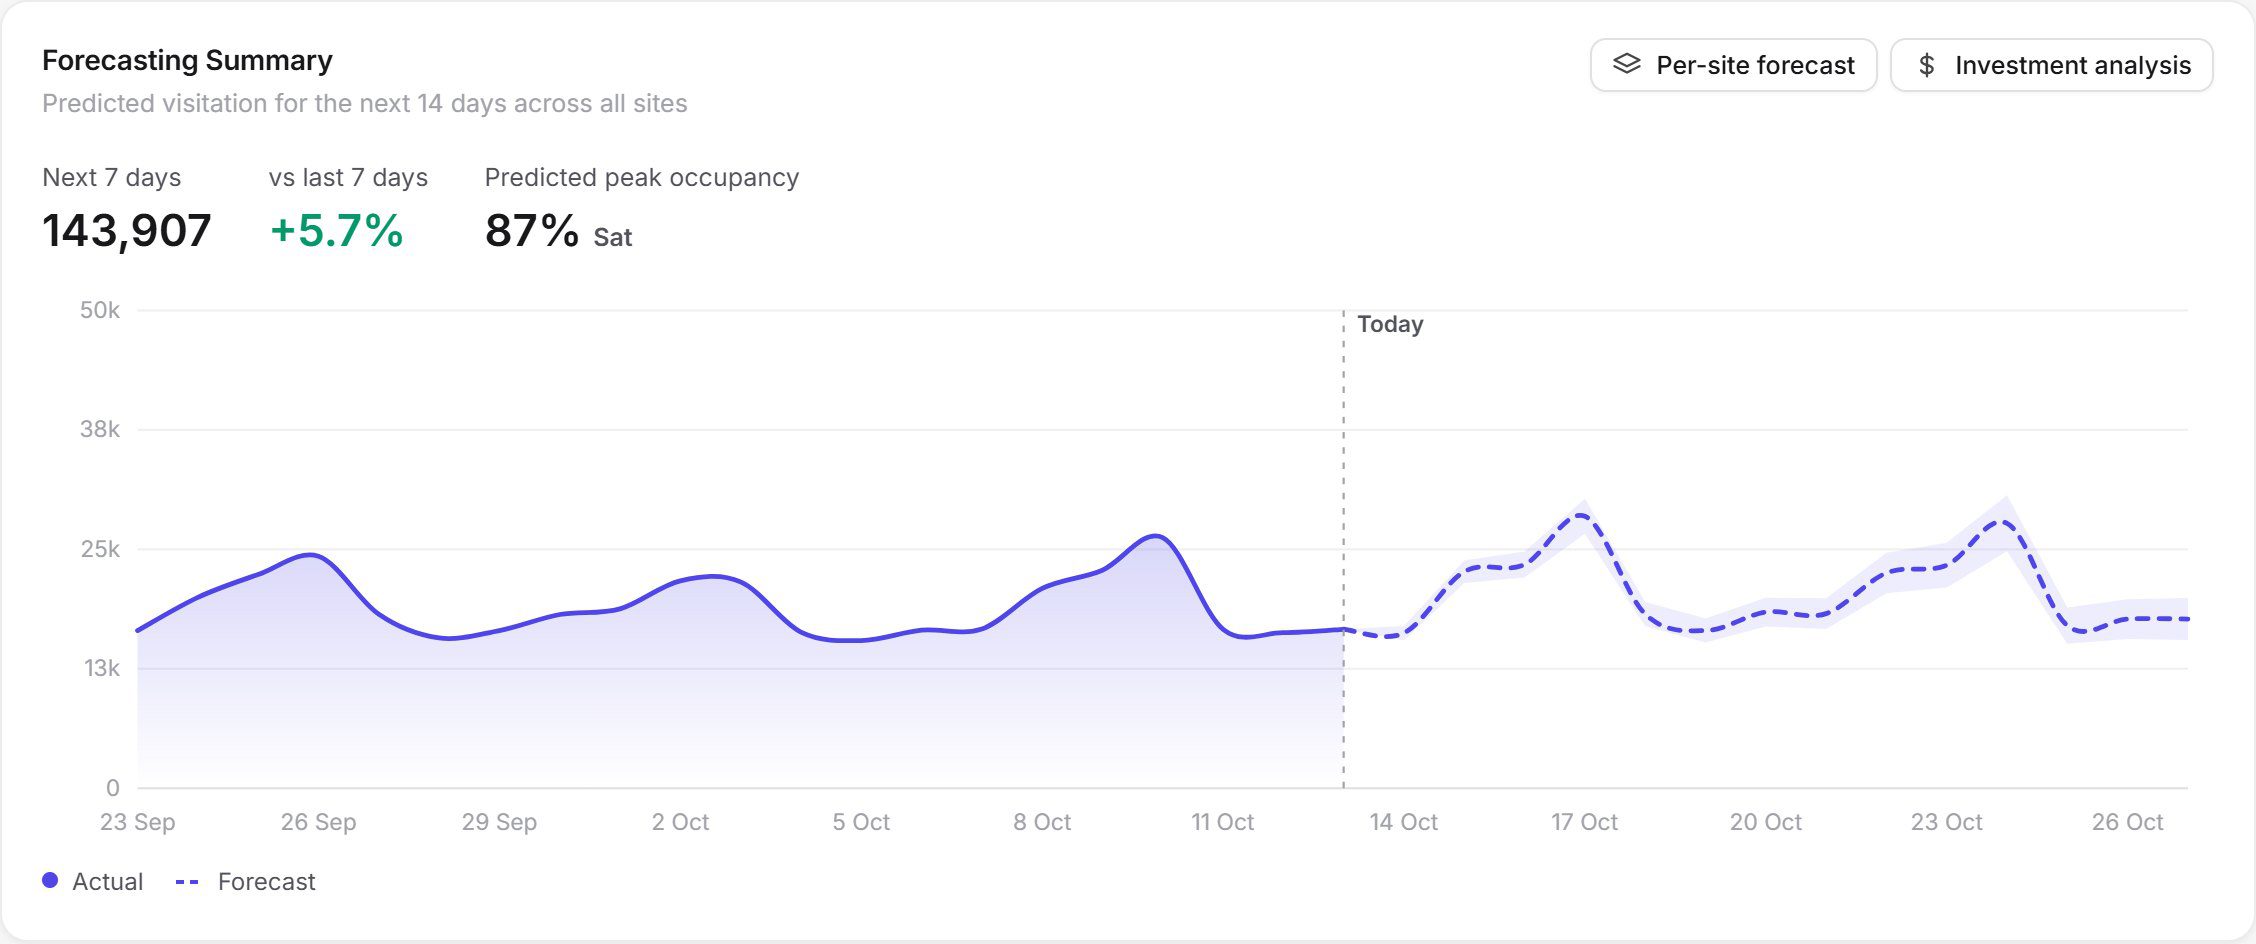
Predicted visitation and occupancy for the weeks ahead, with confidence ranges, per site.

Visitation forecast

Scenario planning

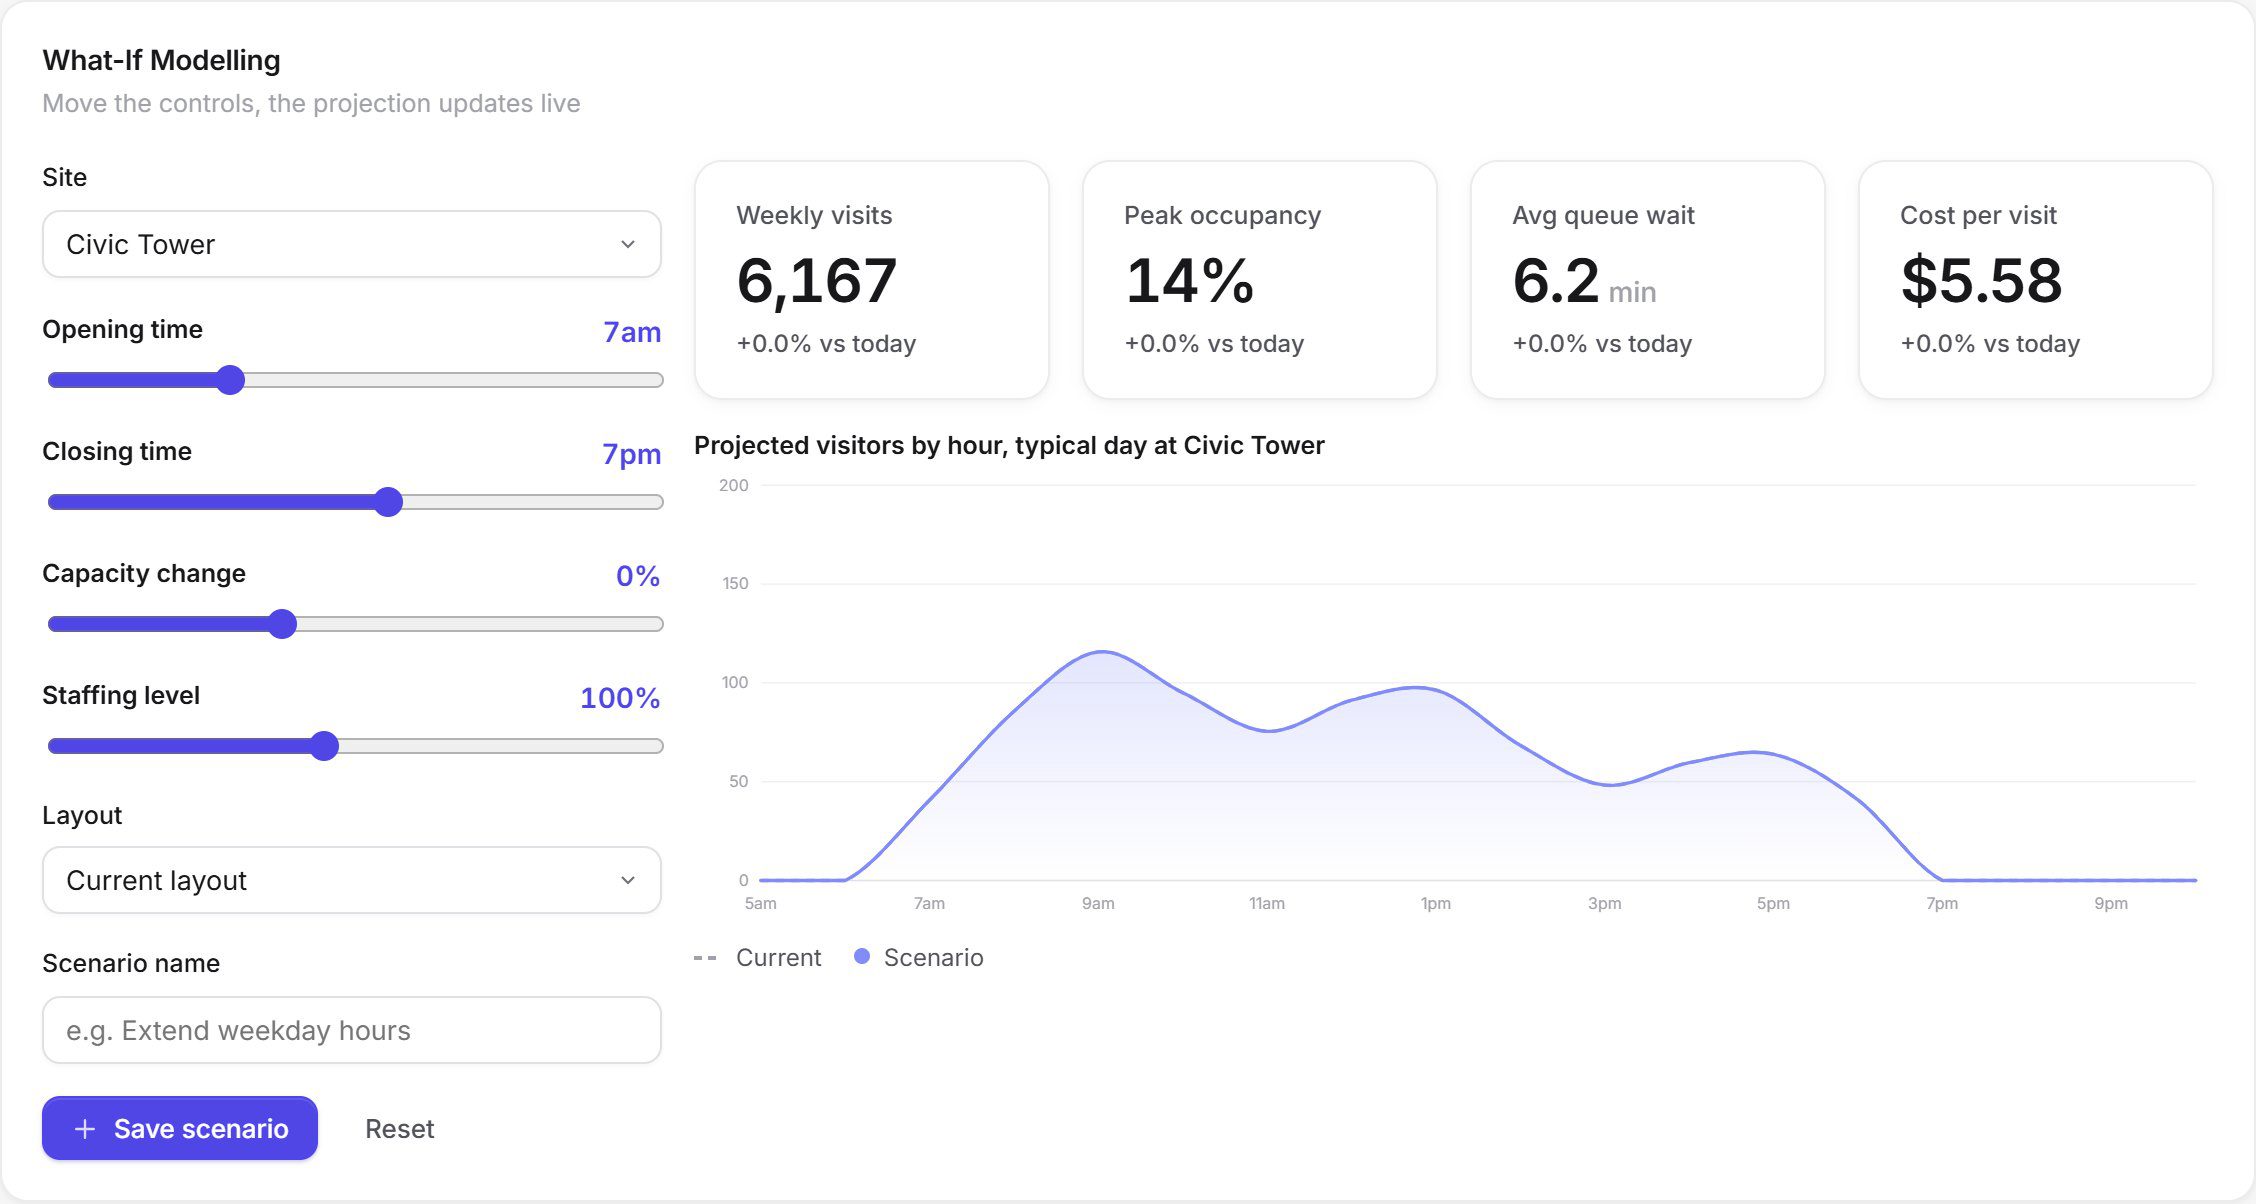
Change opening hours, capacity, staffing or layout and see the projected impact before committing.

What-if scenario modelling

AI insights, every morning

Plain-language recommendations ranked by impact, each with the evidence behind it.

OpportunityExtend Saturday trading by 1 hour+1,350 visits a week · 86% confidence
RiskChildren's Area regularly over capacity9 breaches in 14 weeks · 92% confidence
EfficiencyLevel 12 under 30% used Mon and Fri≈ $41k a year · 81% confidence

Grow at your pace

Start by measuring. Finish by transforming.

Four levels of maturity. Every level includes everything before it, so you can start small and add capability as your organisation is ready.

Compare plans

Level 1

Essentials

Know what's happening.

  • Visitor counting & occupancy
  • Peak periods & dwell time
  • Live dashboards
  • Automated reports
  • Device health
Get a quote
Level 2

Insights

Know why it's happening.

  • Live floorplans
  • Heat maps & visitor flow
  • Zone comparison
  • Repeat visitation
  • Historical trends
Get a quote
Level 3

Professional

Improve how your place performs.

  • Multi-site portfolio
  • Alert rules & escalation
  • Queue & operations
  • POS, Wi-Fi & BMS integrations
  • Single sign-on
Get a quote
Level 4

Executive

Lead with intelligence.

  • Performance index & benchmarking
  • AI insights & Place Assistant
  • Forecasting
  • Scenario modelling
  • Board reporting packs
Get a quote

FAQ

Questions & answers

What is Place Performance?

Place Performance is an end-to-end people counting and place analytics service. It combines privacy-safe sensors, professional installation, a real-time analytics platform and AI insights so councils, universities, government and property owners can see how their places are used and plan with evidence.

What does Place Performance measure?

It measures visitor counts, entries and exits, live occupancy against capacity, peak periods, dwell time, repeat visitation, movement between zones and, outdoors, pedestrians, cyclists and vehicles. Metrics roll up from a single room to a whole portfolio of sites.

Is the hardware included?

Yes. 3D people counters and other sensors are selected for each environment, then designed, supplied, installed, commissioned and supported by Place Performance in Australia, so you deal with one partner from sensor to insight.

Does it identify people?

No. Counting happens on the device and data is masked at source, so only anonymous numbers leave the site. The approach is to measure the place, not the person. See Privacy by design.

Who is it for?

It is built for local councils, universities and TAFEs, state and federal government agencies, commercial property owners, shopping centres and precinct managers, and anyone responsible for libraries, civic centres, venues, parks, trails or streets.

How quickly can we get started?

Most organisations start with a pilot at one site. After a site survey and sensor plan, a pilot is typically live in weeks rather than months, and you can add sites and capability levels as you grow.

See your places in a new light.

Book a 30-minute walkthrough and we'll scope a pilot for one of your sites: sensors, installation, software and insights in one agreement.