Guide
Why real-time occupancy matters.
Occupancy is the number of people in a space right now, compared with how many it can safely or comfortably hold. Historical counts tell you about last month. Real-time occupancy lets you act in the moment: open an overflow room, redeploy staff, slow entry at a gate or tell people where there is space.
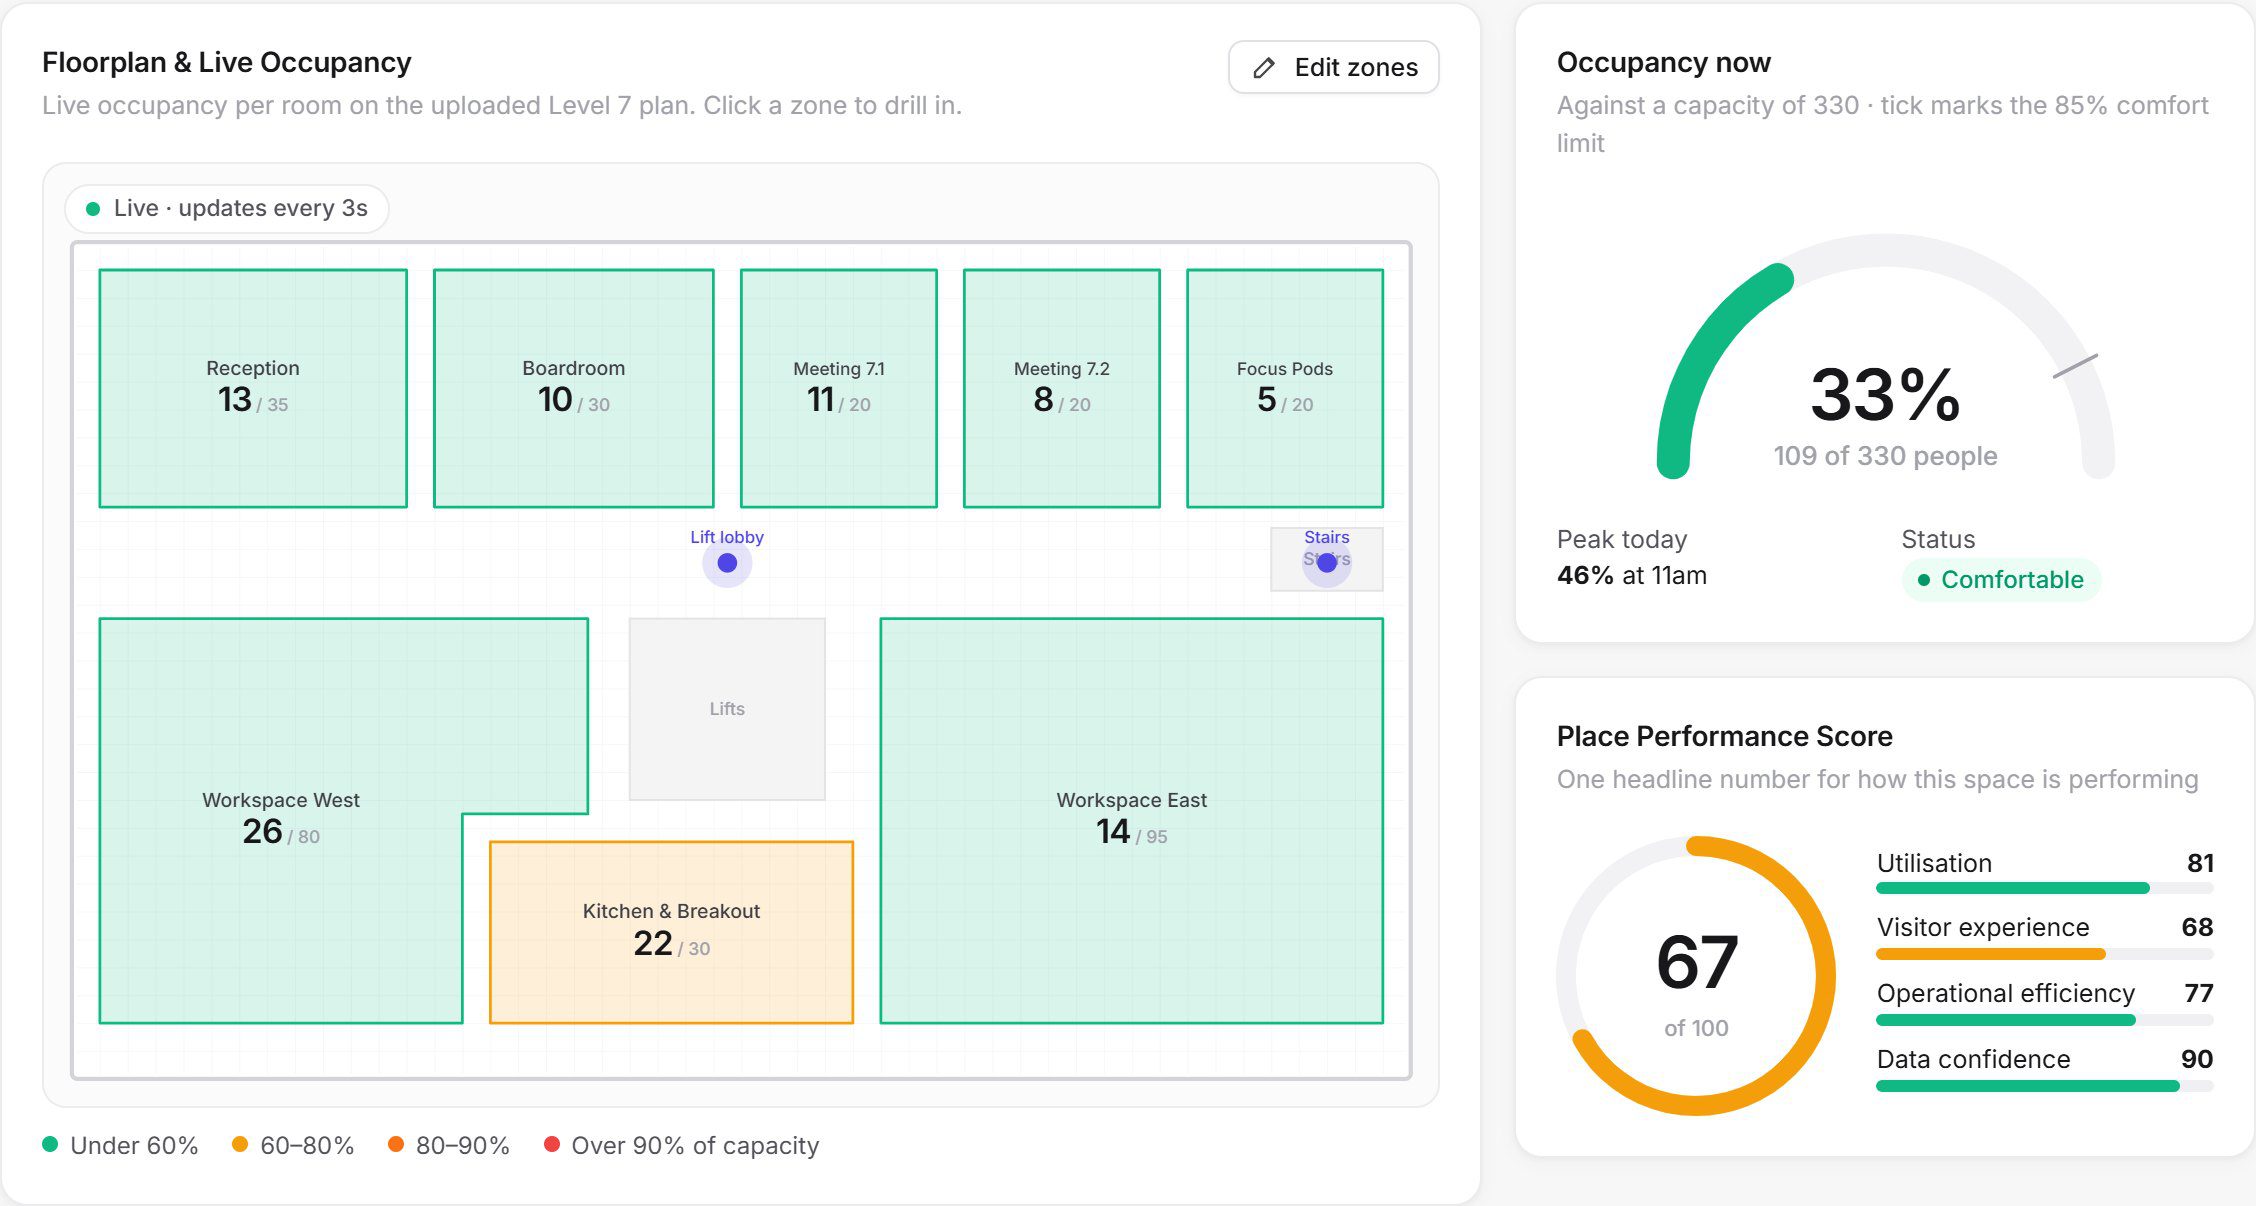
Live floorplans, room by room
Upload a floorplan for each level, draw rooms and zones as shapes, and every zone shows its live headcount, coloured green, amber, orange or red as it fills. Managers see at a glance which areas need attention, and the same view works on a phone for staff walking the floor. It is especially useful in libraries, campus study spaces and office floors.
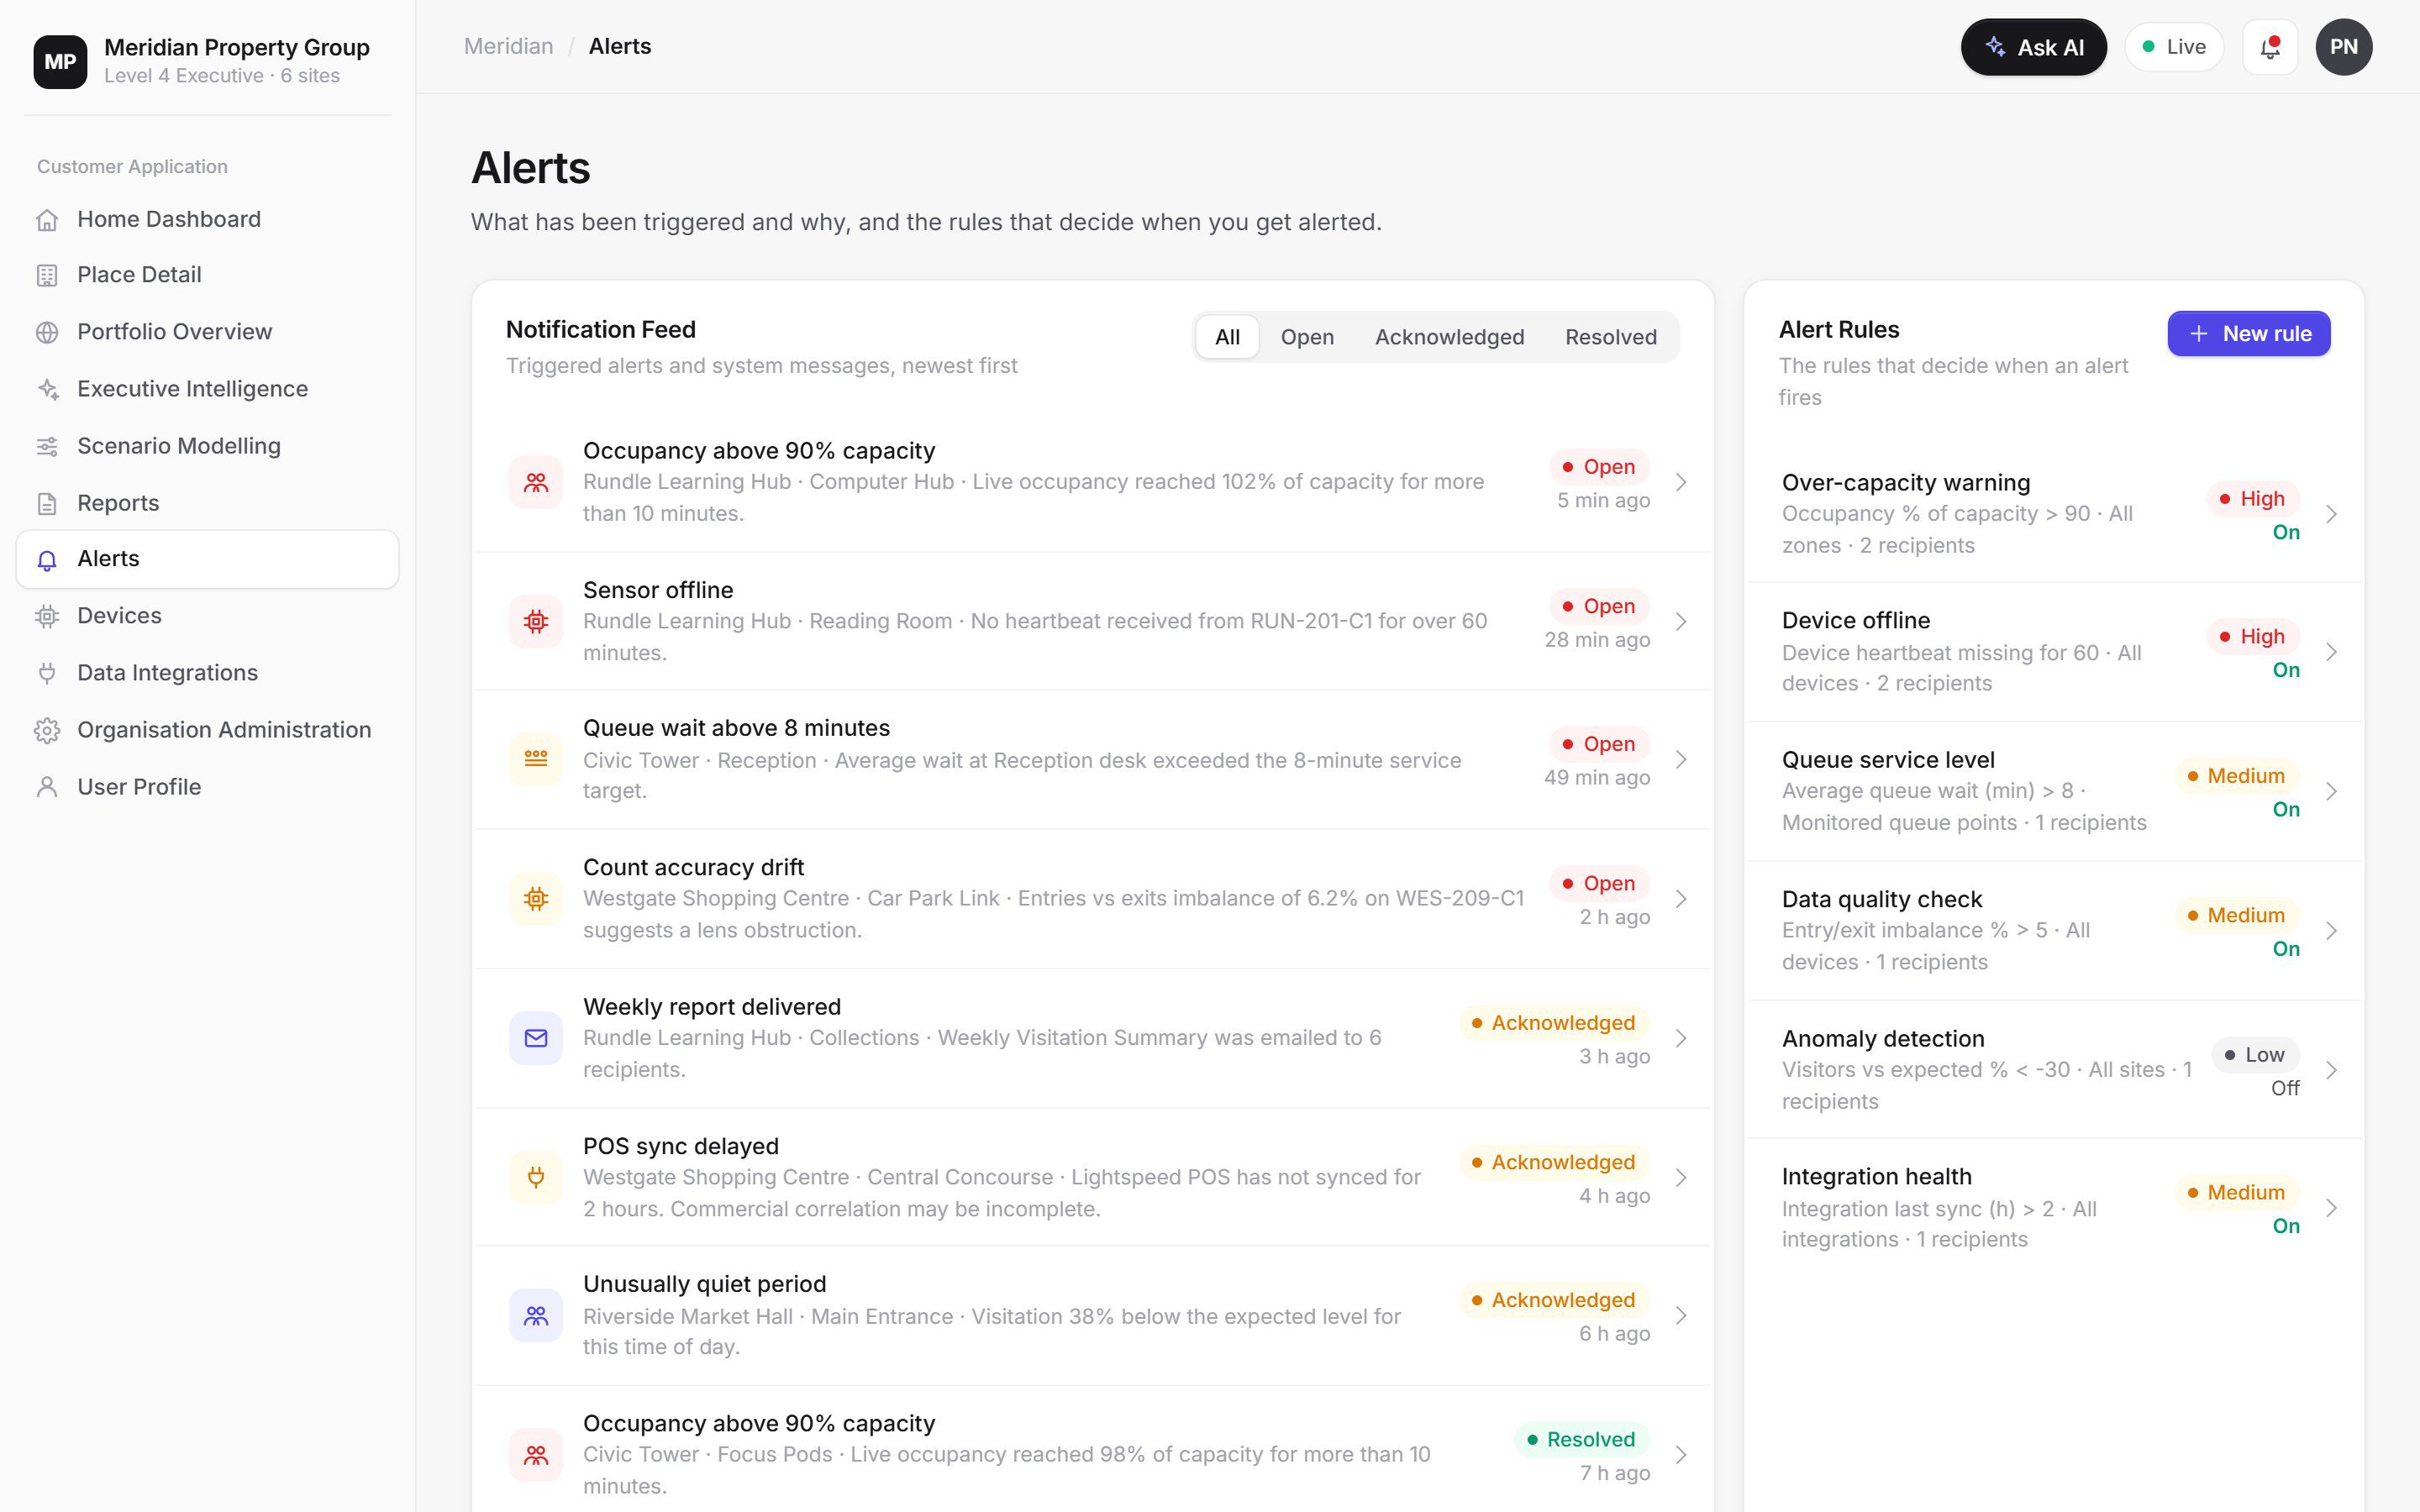
Alerts that reach the right person
Threshold rules watch occupancy, queue wait times, entry and exit imbalances, sensor health and unusual activity. When a rule is breached the right people are notified by email, SMS, Microsoft Teams or in-app, with escalation if nobody acknowledges it. Councils use this for events and community facilities, and stadiums and venues use it to manage crowd capacity at entries.
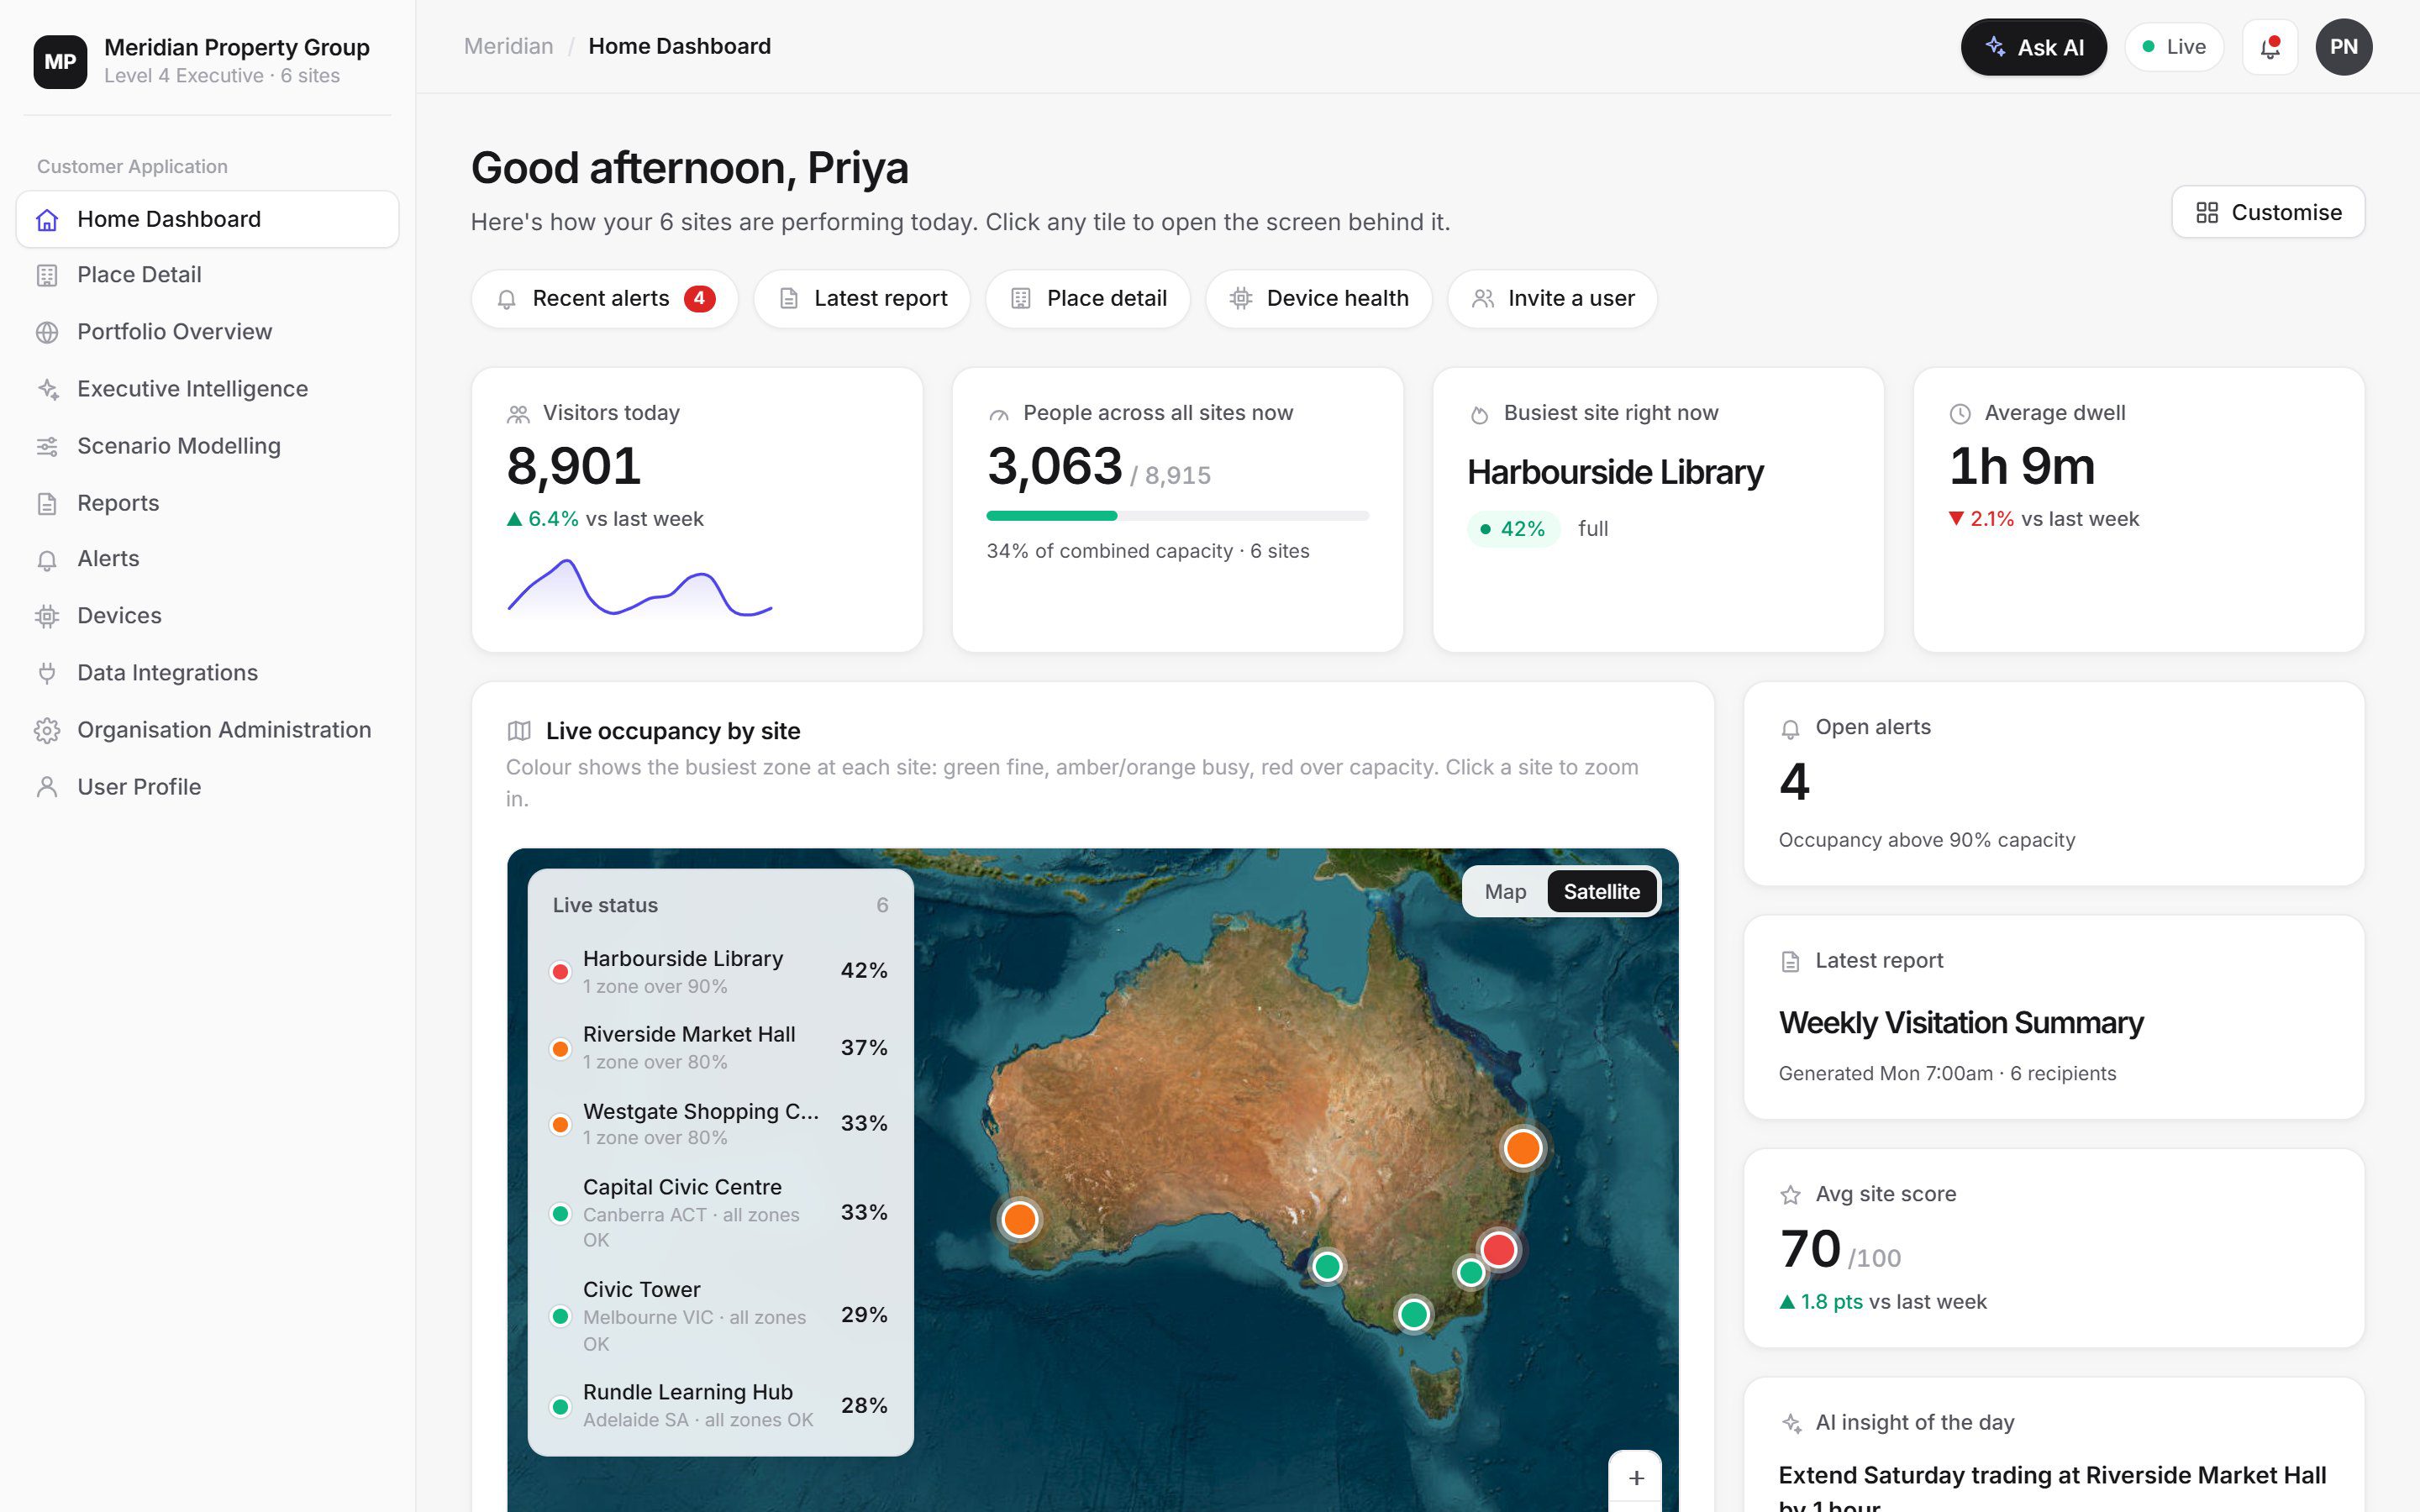
From portfolio to a single zone
Each site on the portfolio map is coloured by its busiest zone, so one overcrowded room flags the whole site even when the building overall looks quiet. One click takes you from the map to the site, the floor and the room. Read more about how data is organised on the platform page.
Real time and history together
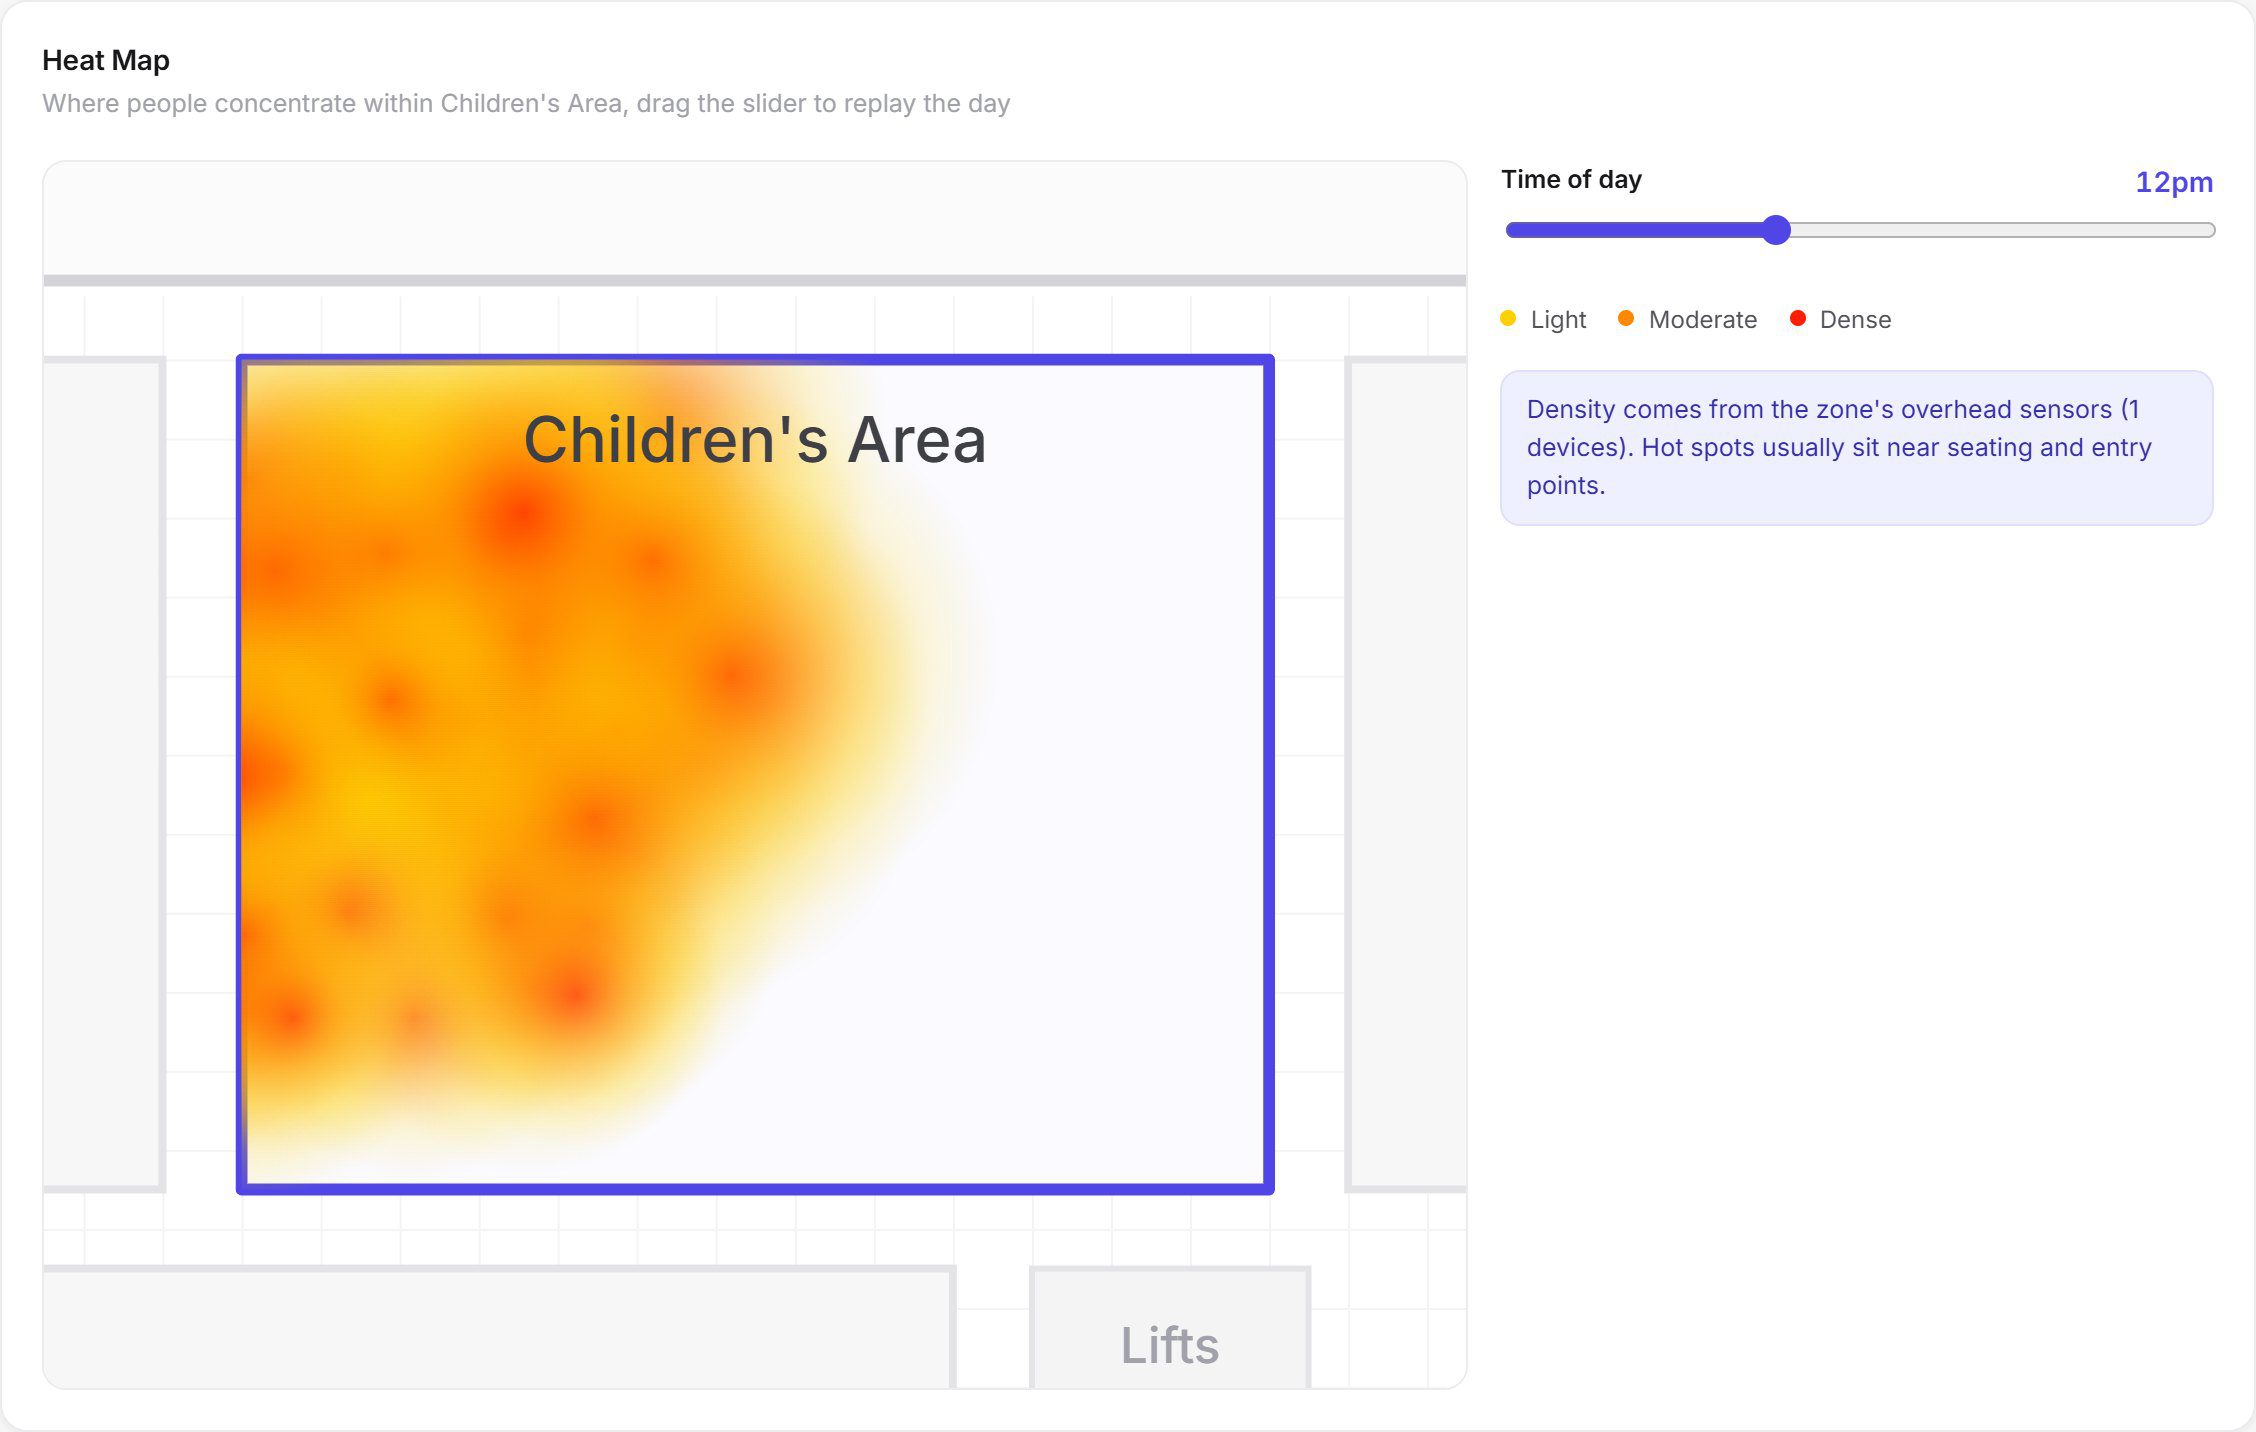
Every live count is stored, so the same data feeds trends, peak-period analysis, reports and visitation forecasting. Operational teams use the live view during the day, and planners use the history to set opening hours, rosters and cleaning schedules. In shopping centres, for example, live food court occupancy triggers cleaning while weekly peaks inform rosters.