Buildings & property

Occupancy analytics for commercial buildings.

Clean, cool and staff spaces when people are actually there, give tenants the data to value their workplace, and prove the return on every refit.

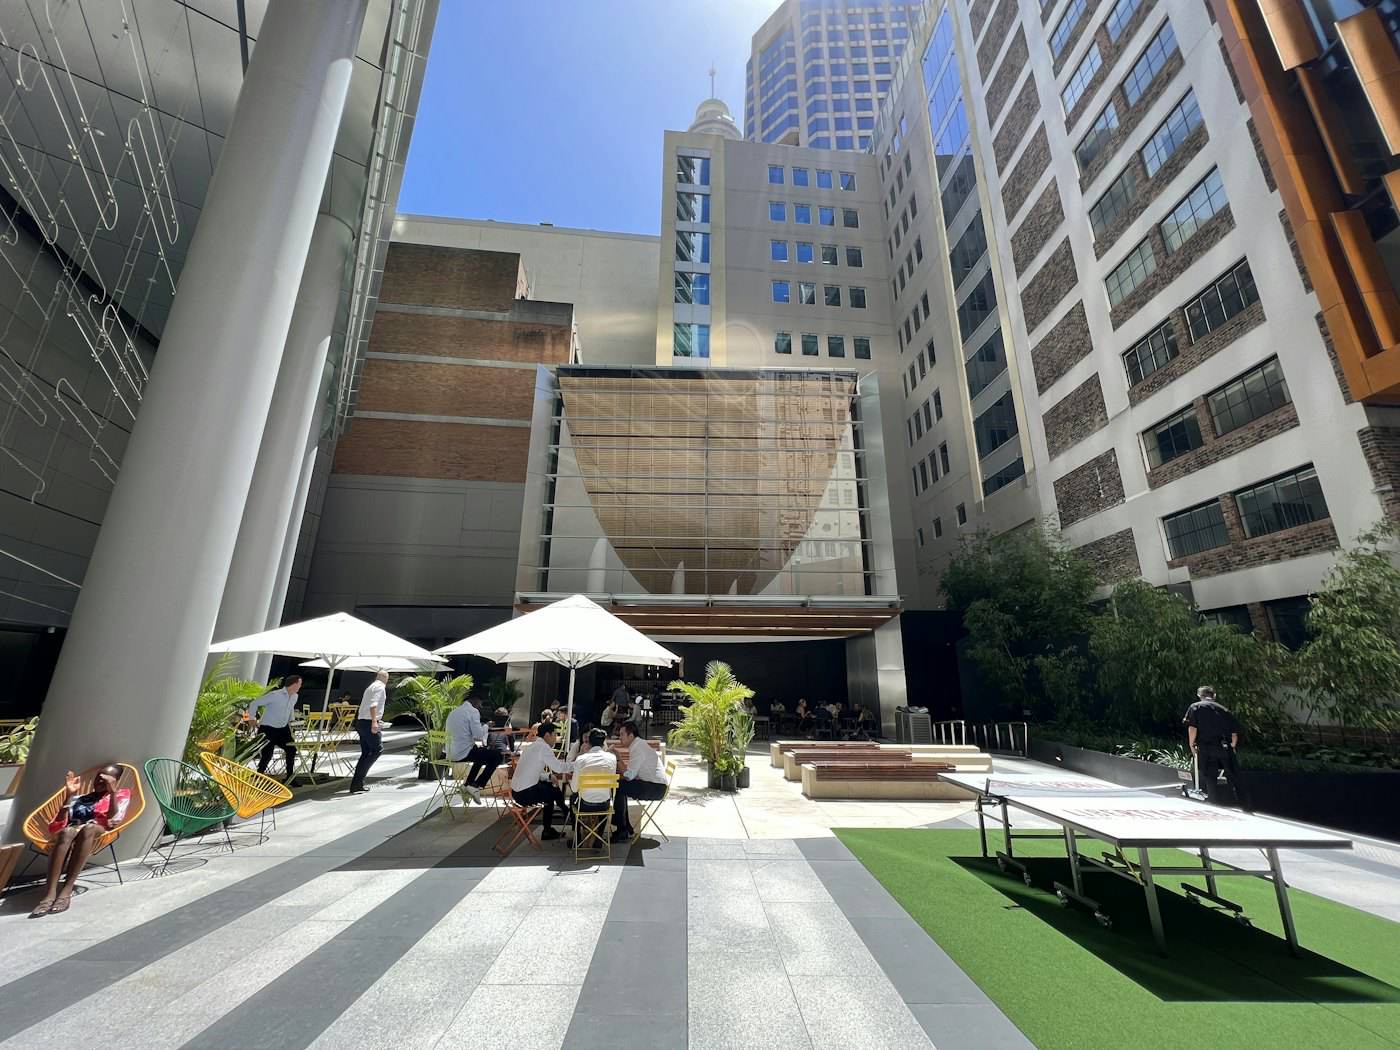
Office tower courtyard in the Sydney CBD

Outcomes

What you can achieve.

  • Demand-based cleaning. Trigger cleans after a set number of visits, not fixed times.
  • Energy and HVAC. Feed occupancy into your BMS and stop conditioning empty floors.
  • Tenant insights. Show tenants how their space performs and support lease decisions.
  • Asset value. Prove the impact of refits with before-and-after analysis.
  • Amenity planning. Size kitchens, meeting rooms and end-of-trip facilities to demand.
  • Reliable data. Monitored sensors with health alerts and local support.

In practice

How it works on site.

Sensors count people as they move through each space. Counting happens on the device, and the numbers appear in the platform within seconds.

Animated illustration of an office floor with meeting room occupancy and lift lobby counting3D people counterIN +1OUT +1Meeting 7.13 / 8 seatsMeeting 7.2Free nowLevel 761 of 160 peopleKitchen busy 12:30
Office towers: floors, meeting rooms and amenities, used on demand.
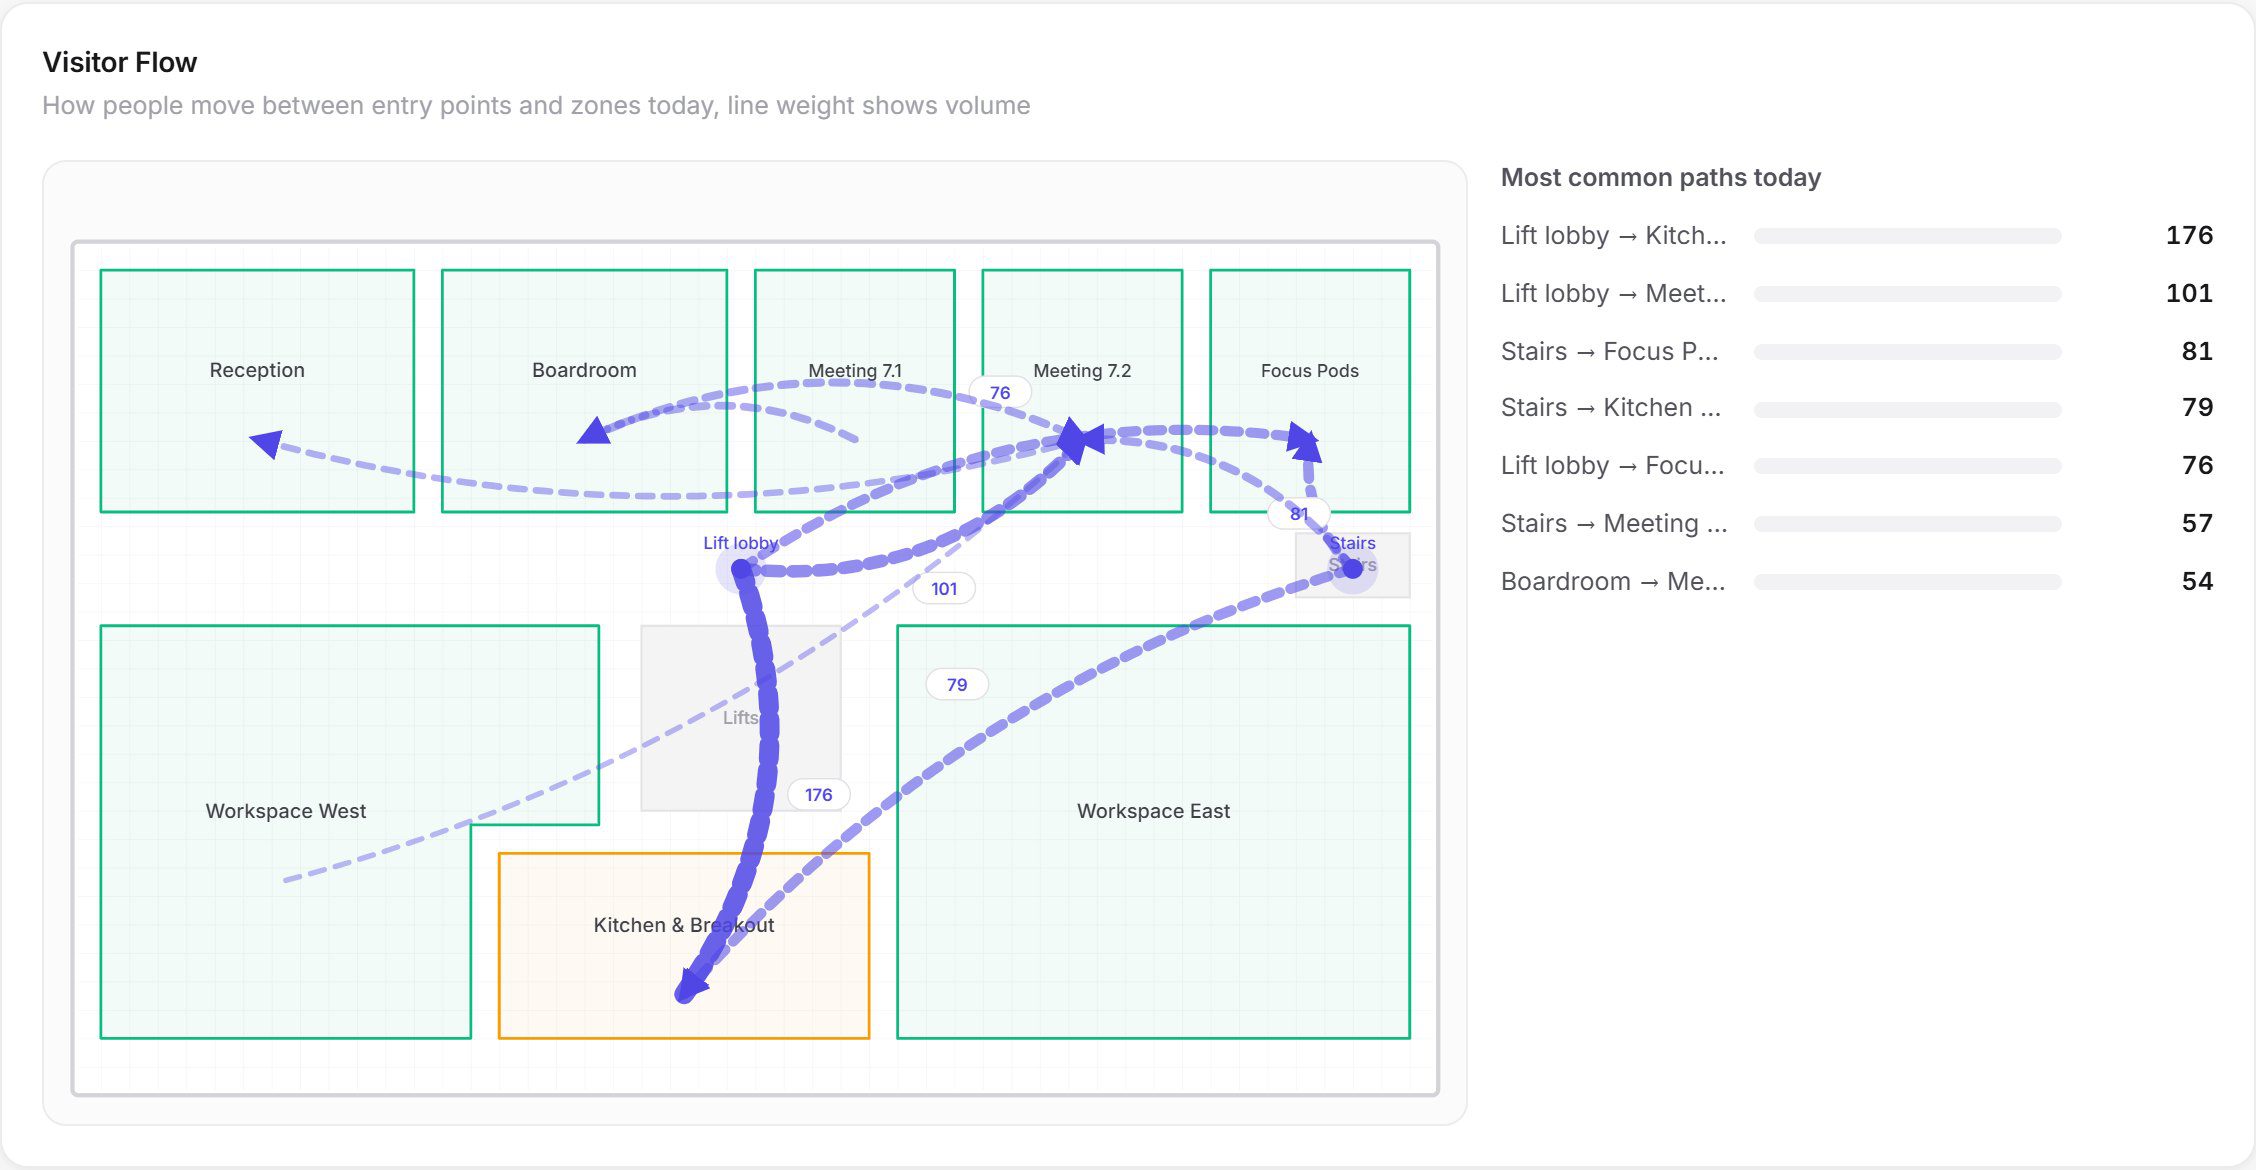
Visitor flow between entrances and zones on a floor

In the platform

See how people move through a floor.

Visitor flow traces the paths between lifts, entrances and amenities, so you can fix pinch points and put services where people actually go.

In the platform

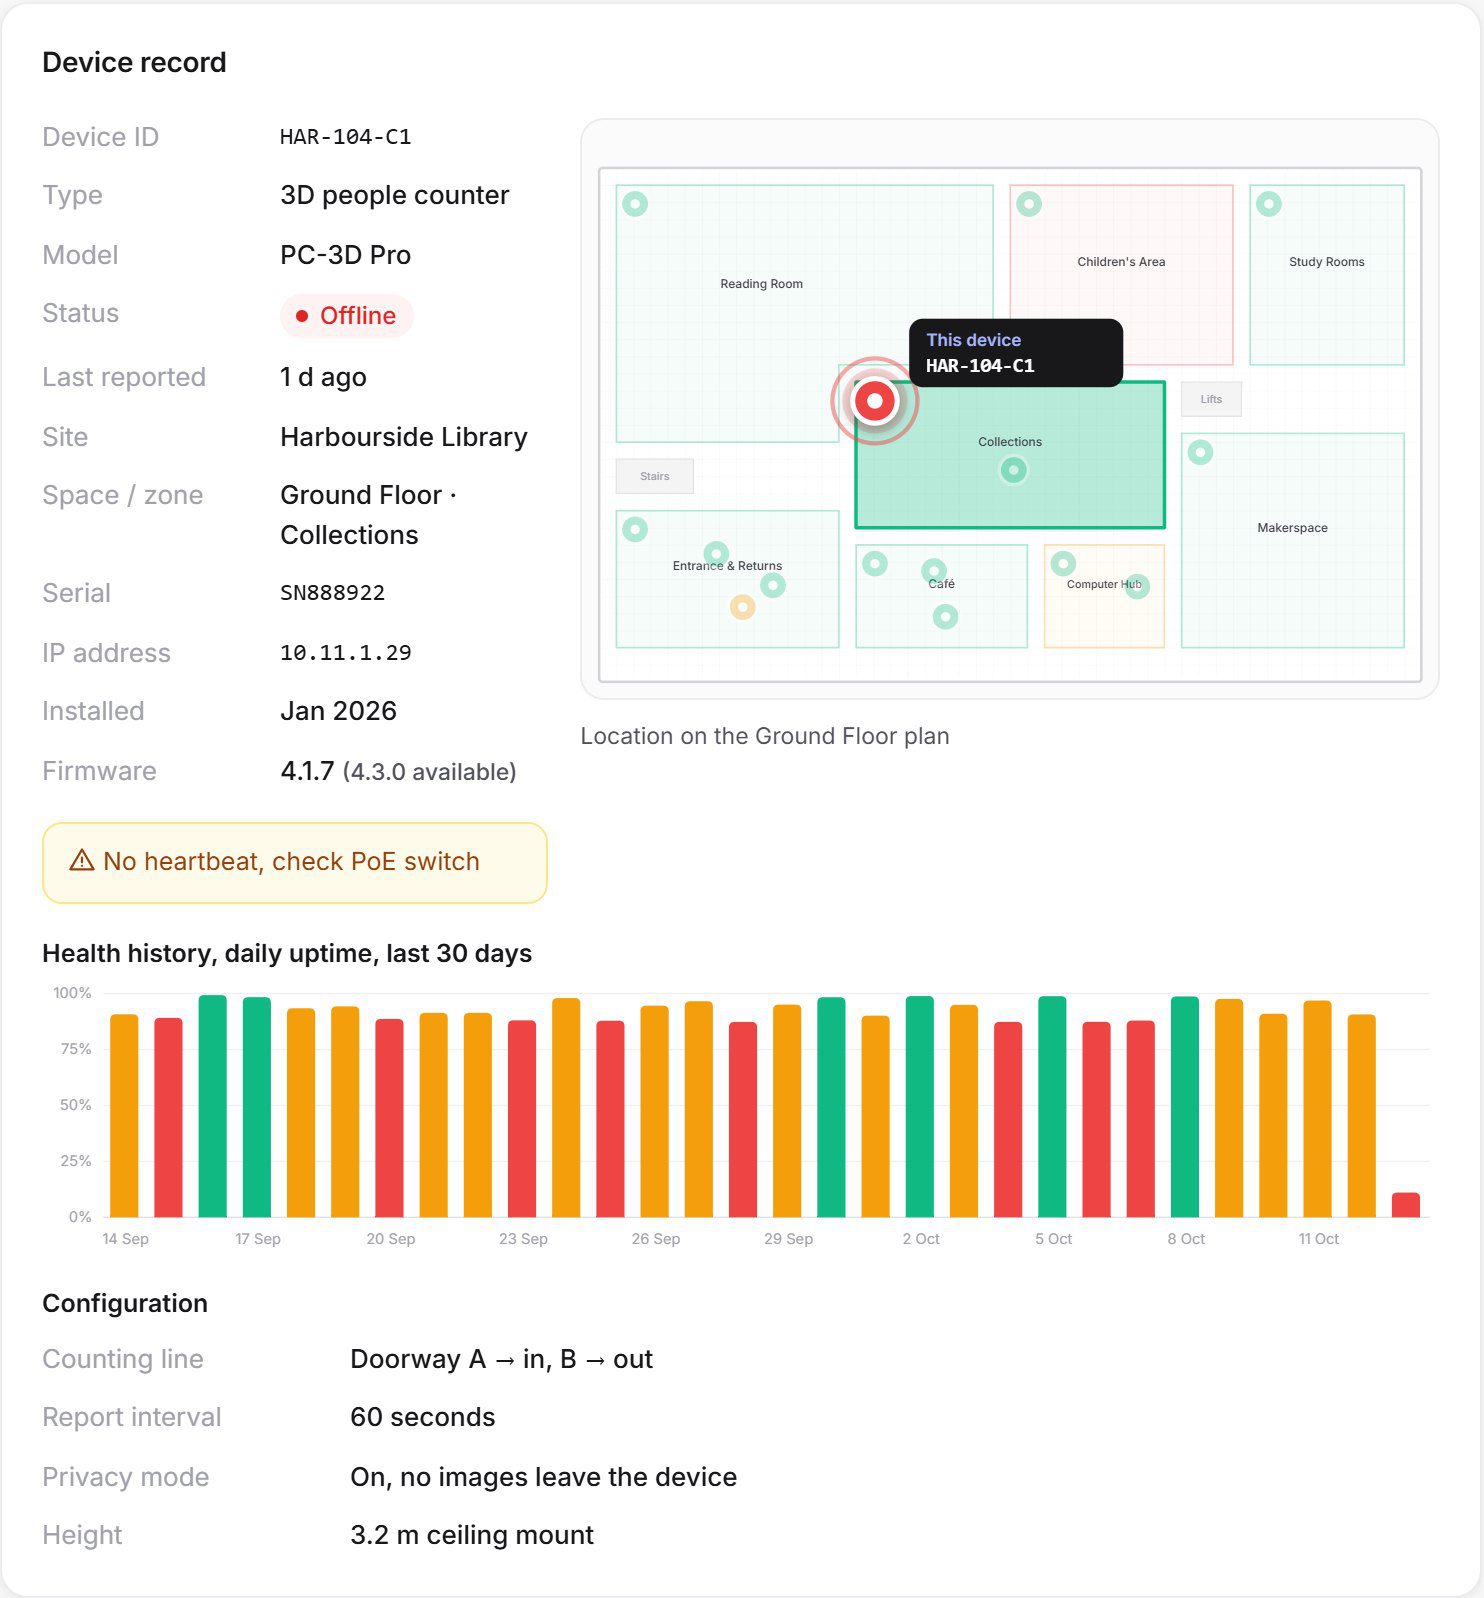
Trust the numbers.

Every sensor is shown on your floorplans with live status and uptime history, and the support team is alerted if one goes quiet.

Device record on a floorplan

Metrics

The numbers you get.

Floor & room occupancy

Live and historical, per tenancy.

Meeting room use

Booked versus used, by size.

Visitor flow

Paths between lifts, entrances and amenities.

Cleaning triggers

Visits since the last clean, per area.

Energy demand

Occupancy signal for HVAC and lighting.

Score

One headline performance number per building.

Guide

Occupancy analytics for commercial property.

For building owners and managers, occupancy is the link between how a building is used and what it costs to run. Measuring it accurately lets you clean, condition and staff space on demand, give tenants evidence about their workplace, and prove the value of capital works.

Operate on demand

Demand-based cleaning triggers a clean after a set number of visits rather than on a fixed timetable. Occupancy shared with the building management system lets HVAC and lighting respond to real use, so empty floors are not conditioned. Live floorplans and alerts keep facilities teams informed through the day.

Tenant and amenity insight

Floor and tenancy occupancy, meeting room use and visitor flow between lifts, entrances and amenities show how space performs. Tenants can be given access to their own data, which supports workplace strategy and lease discussions. Read more about office towers.

Prove the return on refits

Before-and-after analysis compares occupancy, utilisation and dwell around a refurbishment, and forecasting supports the business case for the next one. The Place Performance Score gives each building one headline performance number.

Reliable data, locally supported

Every sensor appears on your floorplans with live status, and our Australian support team is alerted if one goes quiet. See how the service fits together on the platform page, or compare levels on the plans page.

FAQ

Questions & answers

How can occupancy data reduce building operating costs?

Occupancy data lets you clean, heat, cool and light spaces based on actual use. Integrating it with a building management system means empty floors are not conditioned, and cleaning is triggered by visits rather than fixed schedules.

Does it integrate with building management systems?

Yes. Occupancy can be shared with building management systems such as HVAC and lighting controls, and integrations are configured for you.

Can tenants see their own data?

Yes. Access can be limited by site and tenancy, so tenants see occupancy and utilisation for their own space.

Can it prove the value of a refit?

Yes. Investment analysis compares occupancy, utilisation and dwell before and after a refit to show whether it achieved its goals.

How accurate are the sensors?

The 3D counters are calibrated during commissioning, and continuous device health monitoring flags issues early so data stays reliable.

See your places in a new light.

Book a 30-minute walkthrough and we'll scope a pilot for one of your sites: sensors, installation, software and insights in one agreement.