Shopping centres

Footfall analytics for shopping centres.

Measure footfall by entrance, zone and hour, connect visits to sales, and staff, clean and secure the centre for its busiest times.

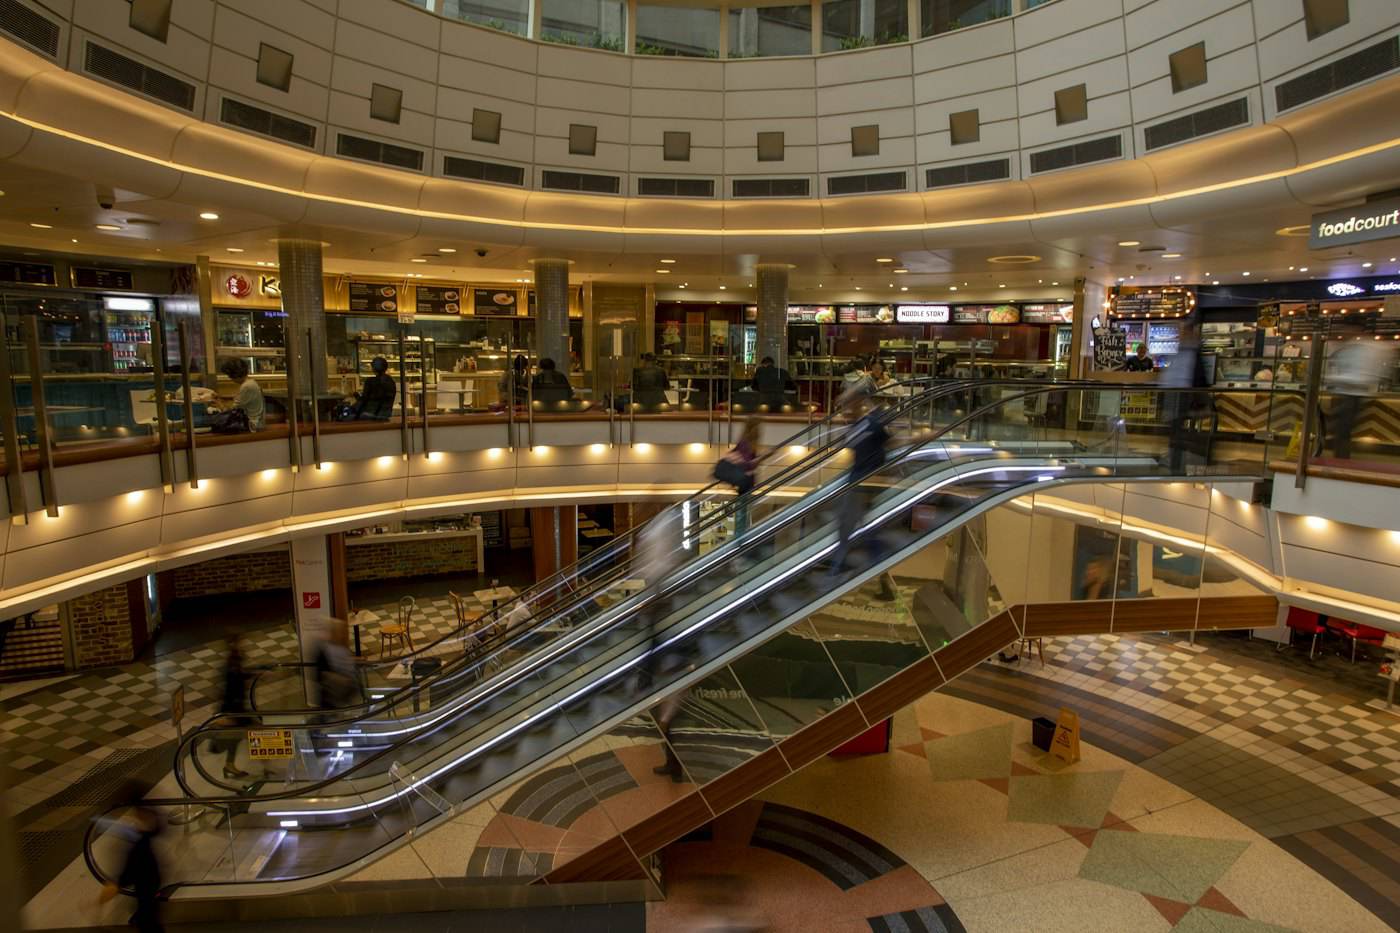
Shopping centre atrium with escalators in Sydney
Footfall & dwell timePictured: Sydney, NSW

Why measure

Footfall is the heartbeat of a centre.

Footfall tells centre managers whether marketing works, which entrances matter, how tenants perform and when to staff. Reliable counting at every entrance, plus sensors in key zones, turns that into a complete picture.

Entrances, malls and food courts

Entrance counters measure footfall by door and hour. Zone sensors show how visitors spread through malls, wings and food courts, and live occupancy helps cleaning and security respond to busy periods as they happen.

Sales and tenant performance

Integrating point-of-sale data turns footfall into conversion and sales per visitor, and zone ranking highlights strong and weak areas for leasing. Read more about footfall analytics for retail and precincts.

Campaigns and planning

Comparing a promotion with the expected baseline shows the uplift it created, and scenario planning tests changes such as extended trading hours. Outdoor counting extends the picture to surrounding streets and laneways.

Typical uses in centres

Centre managers report footfall to owners, leasing teams use zone data in tenant negotiations, marketing teams measure campaign uplift, operations teams roster cleaning and security to peaks, and asset managers compare centres across a portfolio.
In practice

How it works on site.

Sensors count people as they move through each space. Counting happens on the device, and the numbers appear in the platform within seconds.

Animated illustration of a shopping centre mall with footfall counting at the entrance and visitor flow3D people counterIN +1OUT +1Average dwell00:45Footfall today18,940Food court ยท 84%
Shopping centres: footfall, flow between zones and dwell time.

What you can measure

The numbers that matter here.

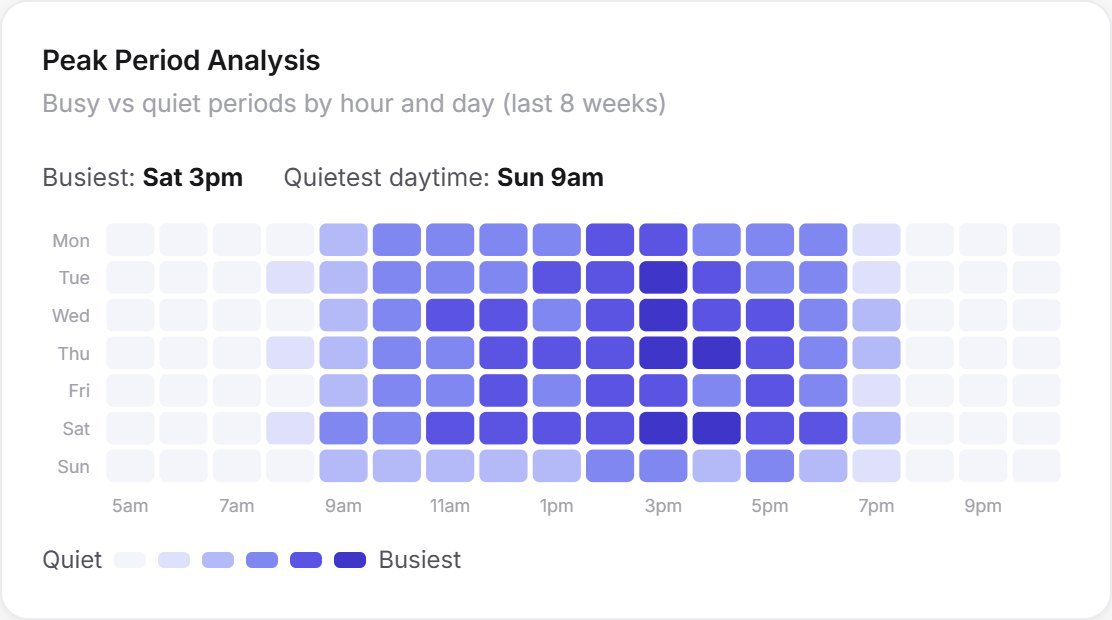
Peak period heat grid for a shopping centre

In the platform

Know the busiest hour of every day.

Peak-period grids show footfall by hour and weekday, so rosters, cleaning and security match the rhythm of the centre.

How it is installed

From site survey to live data.

Our Australian team designs, installs and supports every deployment, so you deal with one partner from the first survey to ongoing maintenance.

How the platform works

  1. Survey. We assess entrances, ceiling heights, layout, lighting, power, network and privacy needs.
  2. Design. A sensor plan places 3D people counters at entrances and over the zones you want to measure.
  3. Install and calibrate. Devices are installed, commissioned and checked for accuracy against manual counts.
  4. Support. Every device reports a heartbeat, and our team is alerted if one needs attention.

FAQ

Questions & answers

How is footfall measured in a shopping centre?

3D people counters above each entrance count people in and out, and sensors in key zones measure occupancy and movement through the centre.

Can footfall be linked to sales?

Yes. Point-of-sale integrations combine visits with sales to calculate conversion and sales per visitor by zone.

Can it monitor food court queues?

Yes. Queue sensors measure queue length and wait time, with alerts when service targets are at risk.

Does footfall counting identify shoppers?

No. Counting is anonymous and processed on the device, with no images or personal information collected.

Can footfall be reported to owners automatically?

Yes. Scheduled reports deliver footfall, dwell and zone performance to owners and managers weekly, monthly or quarterly.

Can it compare centres in a portfolio?

Yes. Portfolio views rank centres and zones by footfall and performance and flag outliers.

See your places in a new light.

Book a 30-minute walkthrough and we'll scope a pilot for one of your sites: sensors, installation, software and insights in one agreement.