
Libraries

People counting and live occupancy for libraries.

Count visits, see live occupancy in reading rooms, children's areas and study spaces, and plan hours and staffing around real demand.

Domed reading room of a state library in Melbourne
Live zone occupancyPictured: Melbourne, VIC

Why measure

The busiest public buildings deserve the best data.

Libraries are among the most visited public buildings in Australia, used for study, events, children's programs, computer access and simply a quiet place to sit. Visitor counts are a core performance measure, but a single number at the door does not show how each part of the building is used.

Every zone, live

Entrance counters measure visits, while zone sensors show live occupancy in reading rooms, children's areas, study rooms and maker spaces. Alerts tell staff before a space reaches its limit, for example when story time fills the children's area, so an overflow room can be opened in time.

Hours and staffing that match demand

Peak-period grids show the busiest and quietest hours of each day, so opening hours, rosters and programs line up with when the community actually visits. Forecasts anticipate school holidays and exam periods.

Evidence for funding

Automated visitation reports provide consistent numbers for annual reports, funding submissions and council briefings. Read how councils and universities use library data, and how counting stays anonymous in privacy by design.

Typical uses in libraries

Branch managers use peak-period data to set rosters, program teams measure attendance at story time and events, facilities teams schedule cleaning after busy periods, and library leaders compare branches to decide where to invest. In university libraries, live occupancy helps students find a seat during exam weeks.
In practice

How it works on site.

Sensors count people as they move through each space. Counting happens on the device, and the numbers appear in the platform within seconds.

Animated illustration of a library with live occupancy in the children's area and reading room3D people counterIN +1OUT +1Children's Area29 / 30 · 97%Reading Room18 / 32 · 58%Visits today2,416
Libraries: visits at the door and live occupancy in every zone.

What you can measure

The numbers that matter here.

Visits

Daily, weekly and seasonal visitation per branch.

Live zone occupancy

Reading rooms, children's areas and study spaces right now.

Learn more

Capacity alerts

Notifications before a zone reaches its limit.

Learn more

Peak periods

Busiest and quietest hours by day.

Dwell time

How long visitors stay in each area.

Forecasts

Expected demand for holidays and programs.

Learn more
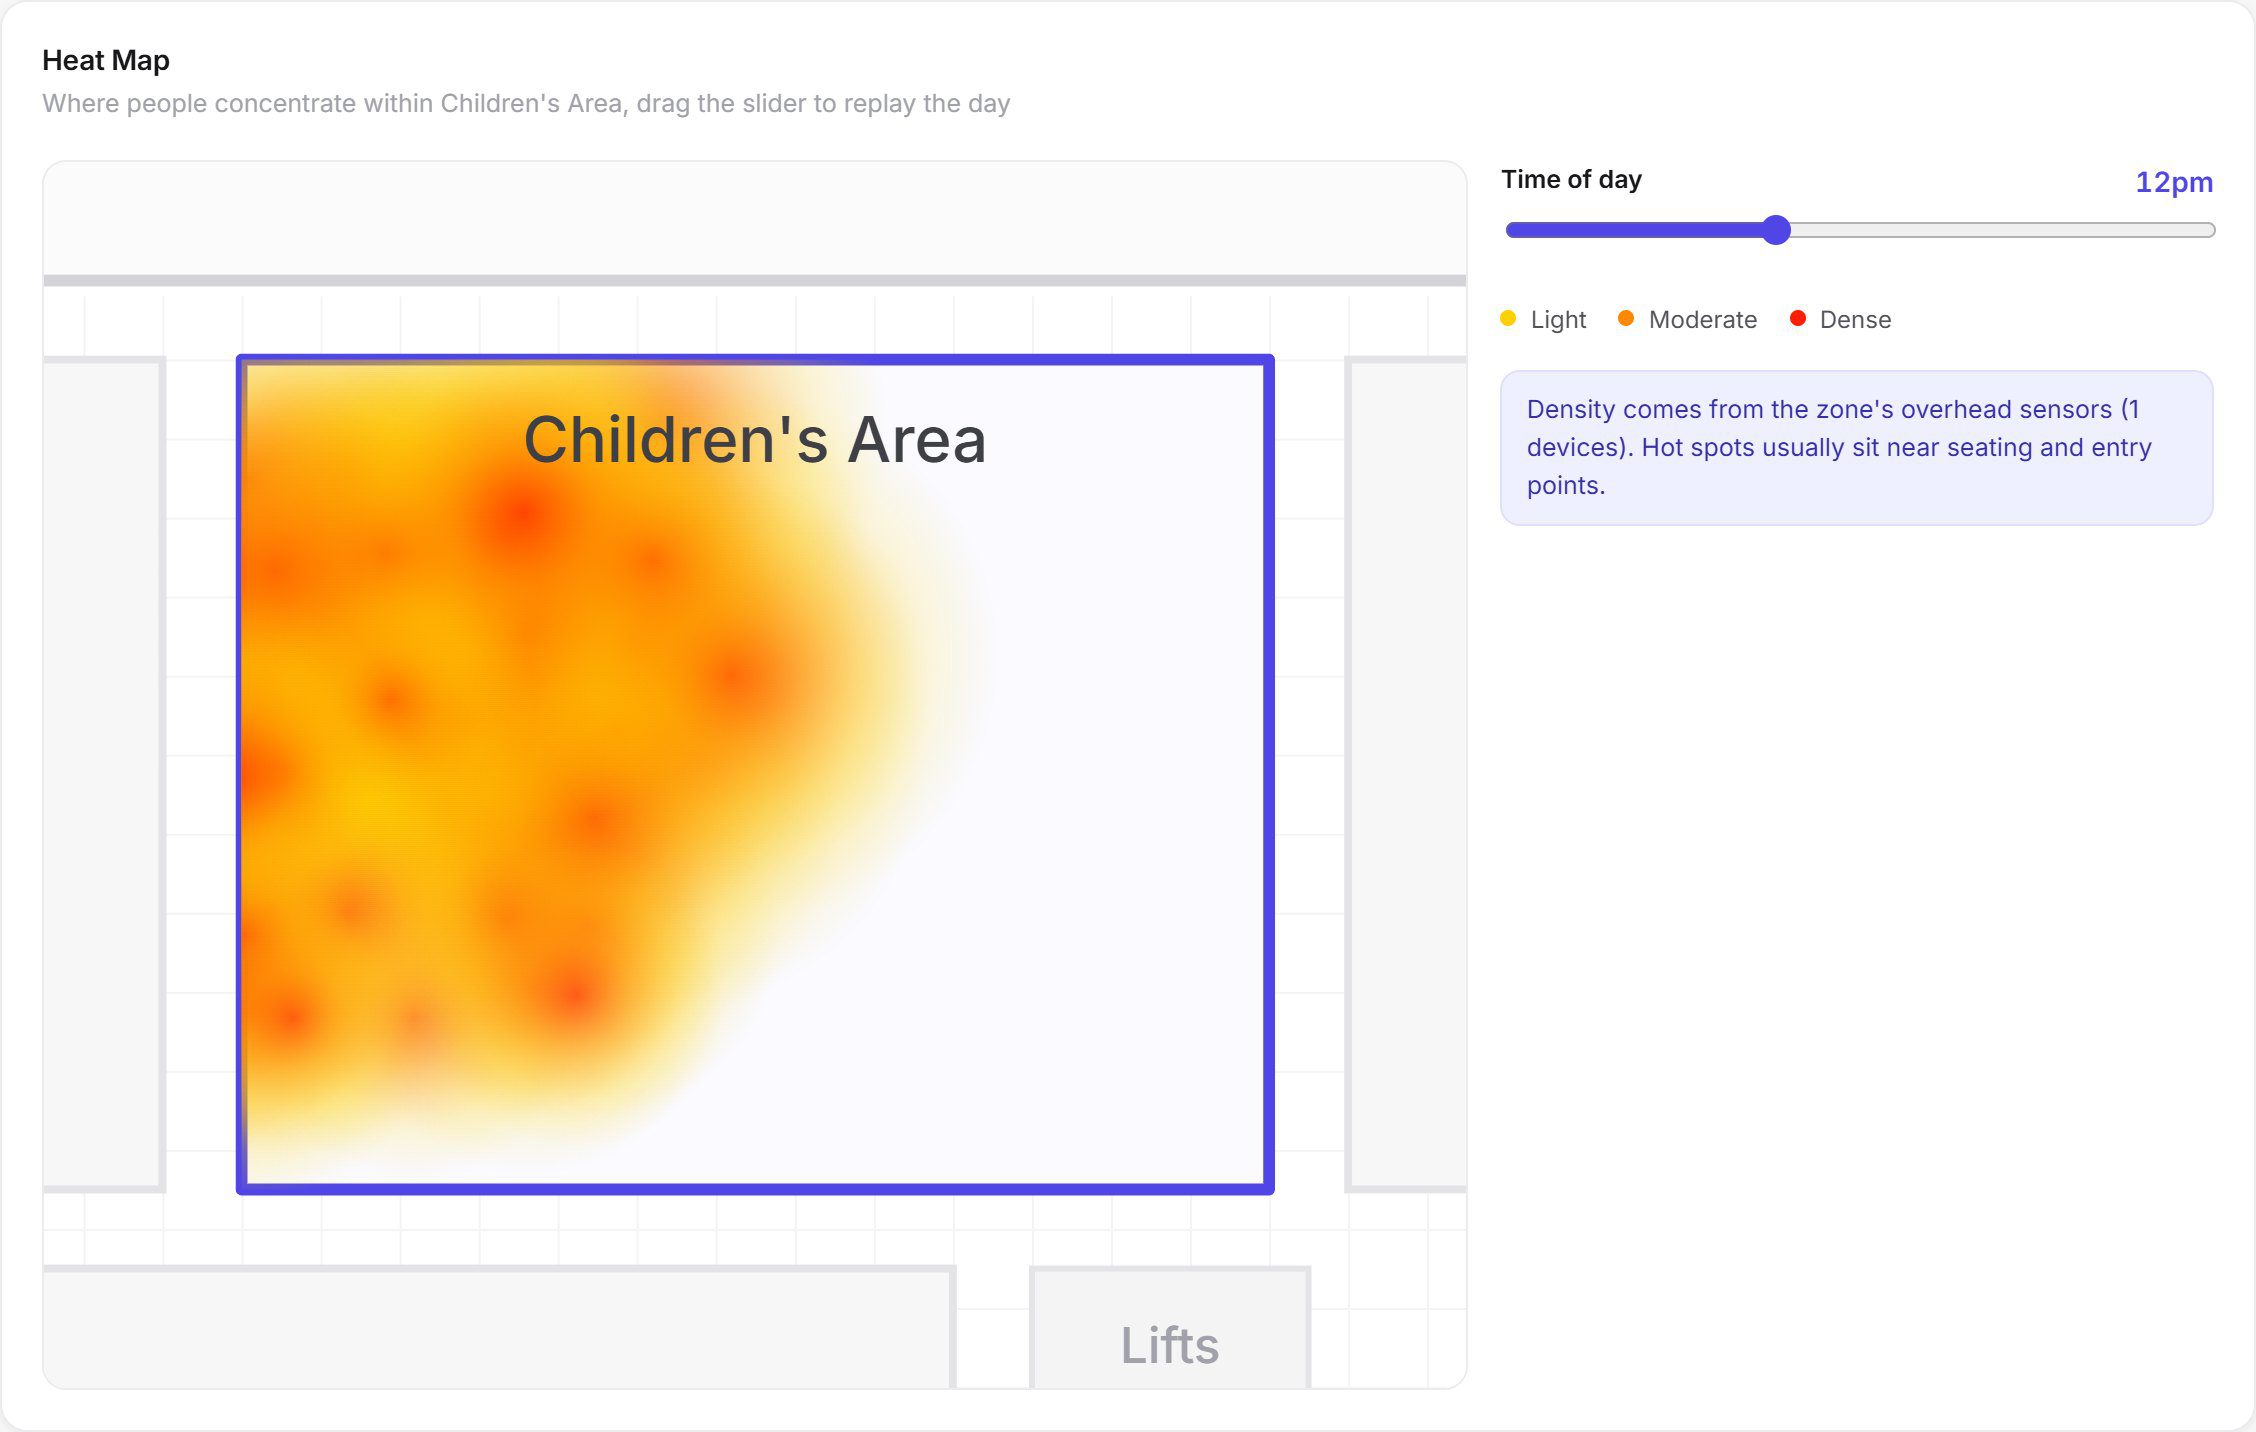
Heat map of a library children's area

In the platform

See where people gather.

Heat maps show where visitors concentrate within a zone and replay the day hour by hour, so layouts, seating and programs can be planned around real behaviour.

How it is installed

From site survey to live data.

Our Australian team designs, installs and supports every deployment, so you deal with one partner from the first survey to ongoing maintenance.

How the platform works

  1. Survey. We assess entrances, ceiling heights, layout, lighting, power, network and privacy needs.
  2. Design. A sensor plan places 3D people counters at entrances and over the zones you want to measure.
  3. Install and calibrate. Devices are installed, commissioned and checked for accuracy against manual counts.
  4. Support. Every device reports a heartbeat, and our team is alerted if one needs attention.

FAQ

Questions & answers

How do libraries count visitors?

Ceiling-mounted 3D sensors at each entrance count people in and out. Additional sensors over key zones measure live occupancy in areas such as reading rooms and children's spaces.

Can a library see how full each area is right now?

Yes. Each zone is drawn on a floorplan and shows its live headcount, coloured by how full it is, with alerts before limits are reached.

Is library people counting anonymous?

Yes. Processing happens on the device and no images or personal information are collected, only anonymous counts.

Can visitation data be used for funding reports?

Yes. Scheduled reports provide consistent, independent visitation numbers for annual reports, grant applications and briefings.

Can it count attendance at library programs and events?

Yes. Zone sensors in program rooms and children's areas measure attendance and occupancy during story time, workshops and events.

Can several branches be compared?

Yes. Multi-site views compare visitation, occupancy and peak periods across branches so investment and staffing can be prioritised.

See your places in a new light.

Book a 30-minute walkthrough and we'll scope a pilot for one of your sites: sensors, installation, software and insights in one agreement.