Stadiums & venues

Crowd capacity monitoring for stadiums and venues.

Track entries and live crowd numbers against venue limits, get alerted before areas fill, and use attendance data to plan the next event.

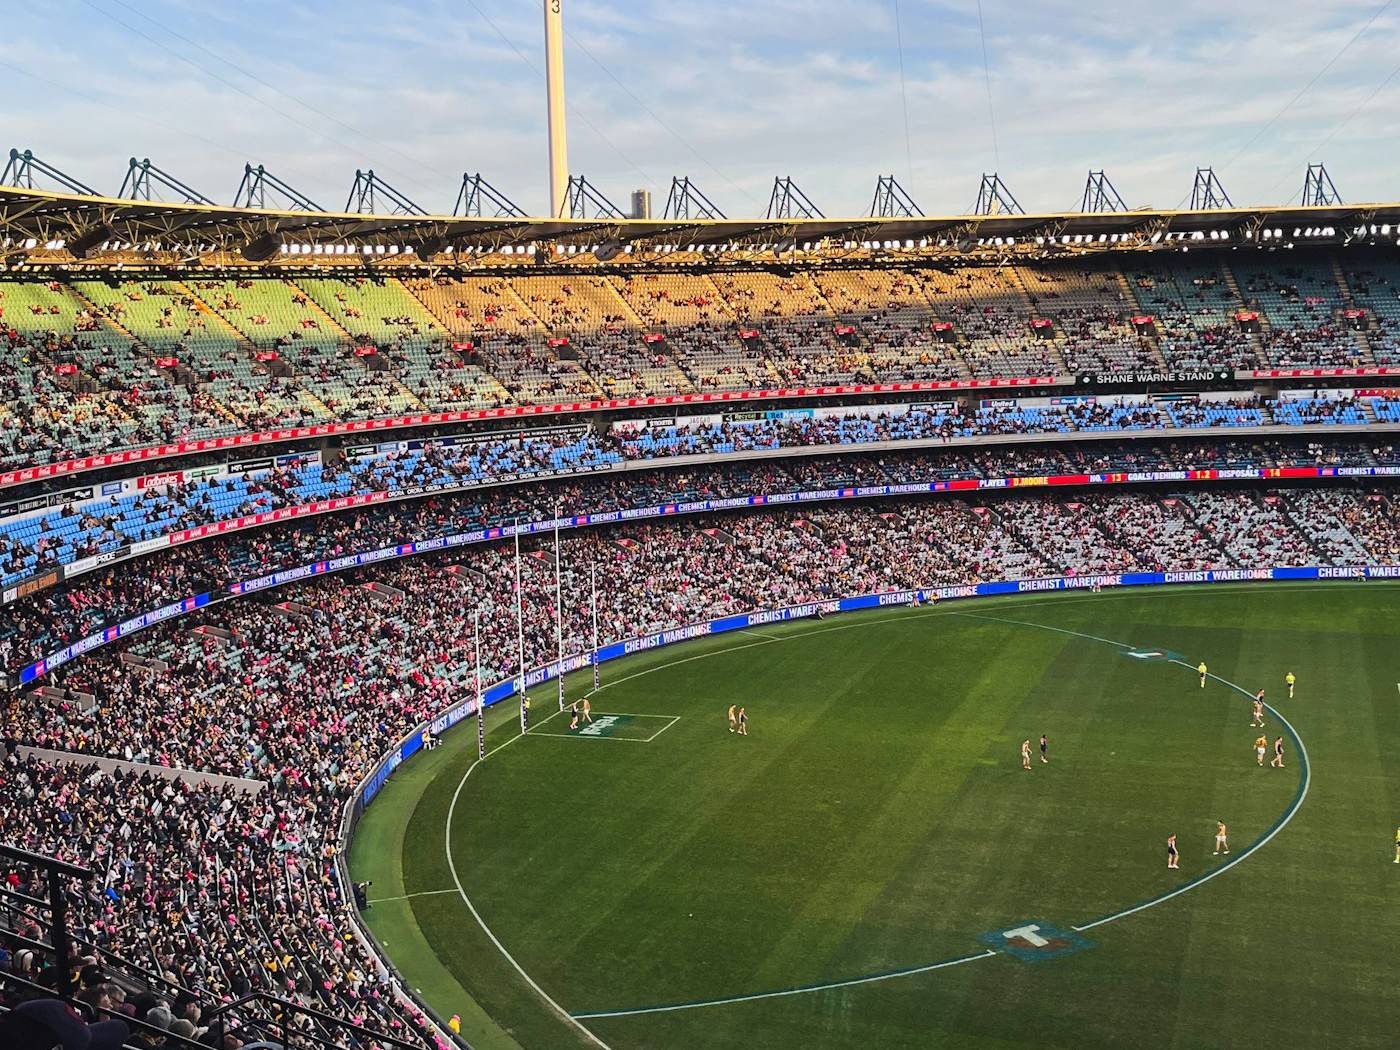
Crowd filling a stadium in Melbourne
Crowd capacity alertsPictured: Melbourne, VIC

Why measure

Safe crowds start with accurate numbers.

Stadiums, arenas, showgrounds and event spaces have to know how many people are inside, where they are, and how fast more are arriving. Accurate live numbers support safety decisions, while history supports planning and reporting.

Entry flow and live attendance

Counters at gates and entries measure inflow and outflow, giving a live attendance figure and entry rate by gate. Operations teams can see which gates are under pressure and redirect staff or patrons.

Zones against their limits

Concourses, bars, function rooms and fan zones each have their own limits. Zone occupancy against those limits, with alerts by SMS, Teams or email, helps staff act before an area becomes unsafe.

Temporary and permanent deployments

Permanent systems suit venues with regular events, while temporary counting can be deployed for festivals and one-off events, a common need for councils. After the event, reports and forecasts inform staffing and layout for the next one.

Typical uses at venues

Operations teams watch live attendance and gate pressure on event days, safety officers receive alerts when zones approach their limits, planners compare attendance and peak arrival times across events, and commercial teams measure how crowds use bars, retail and function spaces.
In practice

How it works on site.

Sensors count people as they move through each space. Counting happens on the device, and the numbers appear in the platform within seconds.

Animated illustration of stadium gates counting arrivals with live attendance and a capacity alert3D people countersIN +1IN +1IN +1Concourse92% of limitLive attendance41,862Alert sent ยท Gate A busy
Stadiums and venues: arrivals by gate and live crowd capacity.

What you can measure

The numbers that matter here.

Live attendance

People inside now, against venue capacity.

Learn more

Entry rate

Arrivals per minute by gate.

Zone occupancy

Concourses, bars and fan zones vs their limits.

Capacity alerts

Escalating notifications before limits.

Learn more

Event comparison

Attendance and peaks across events.

Forecasts

Expected arrivals for planning.

Learn more
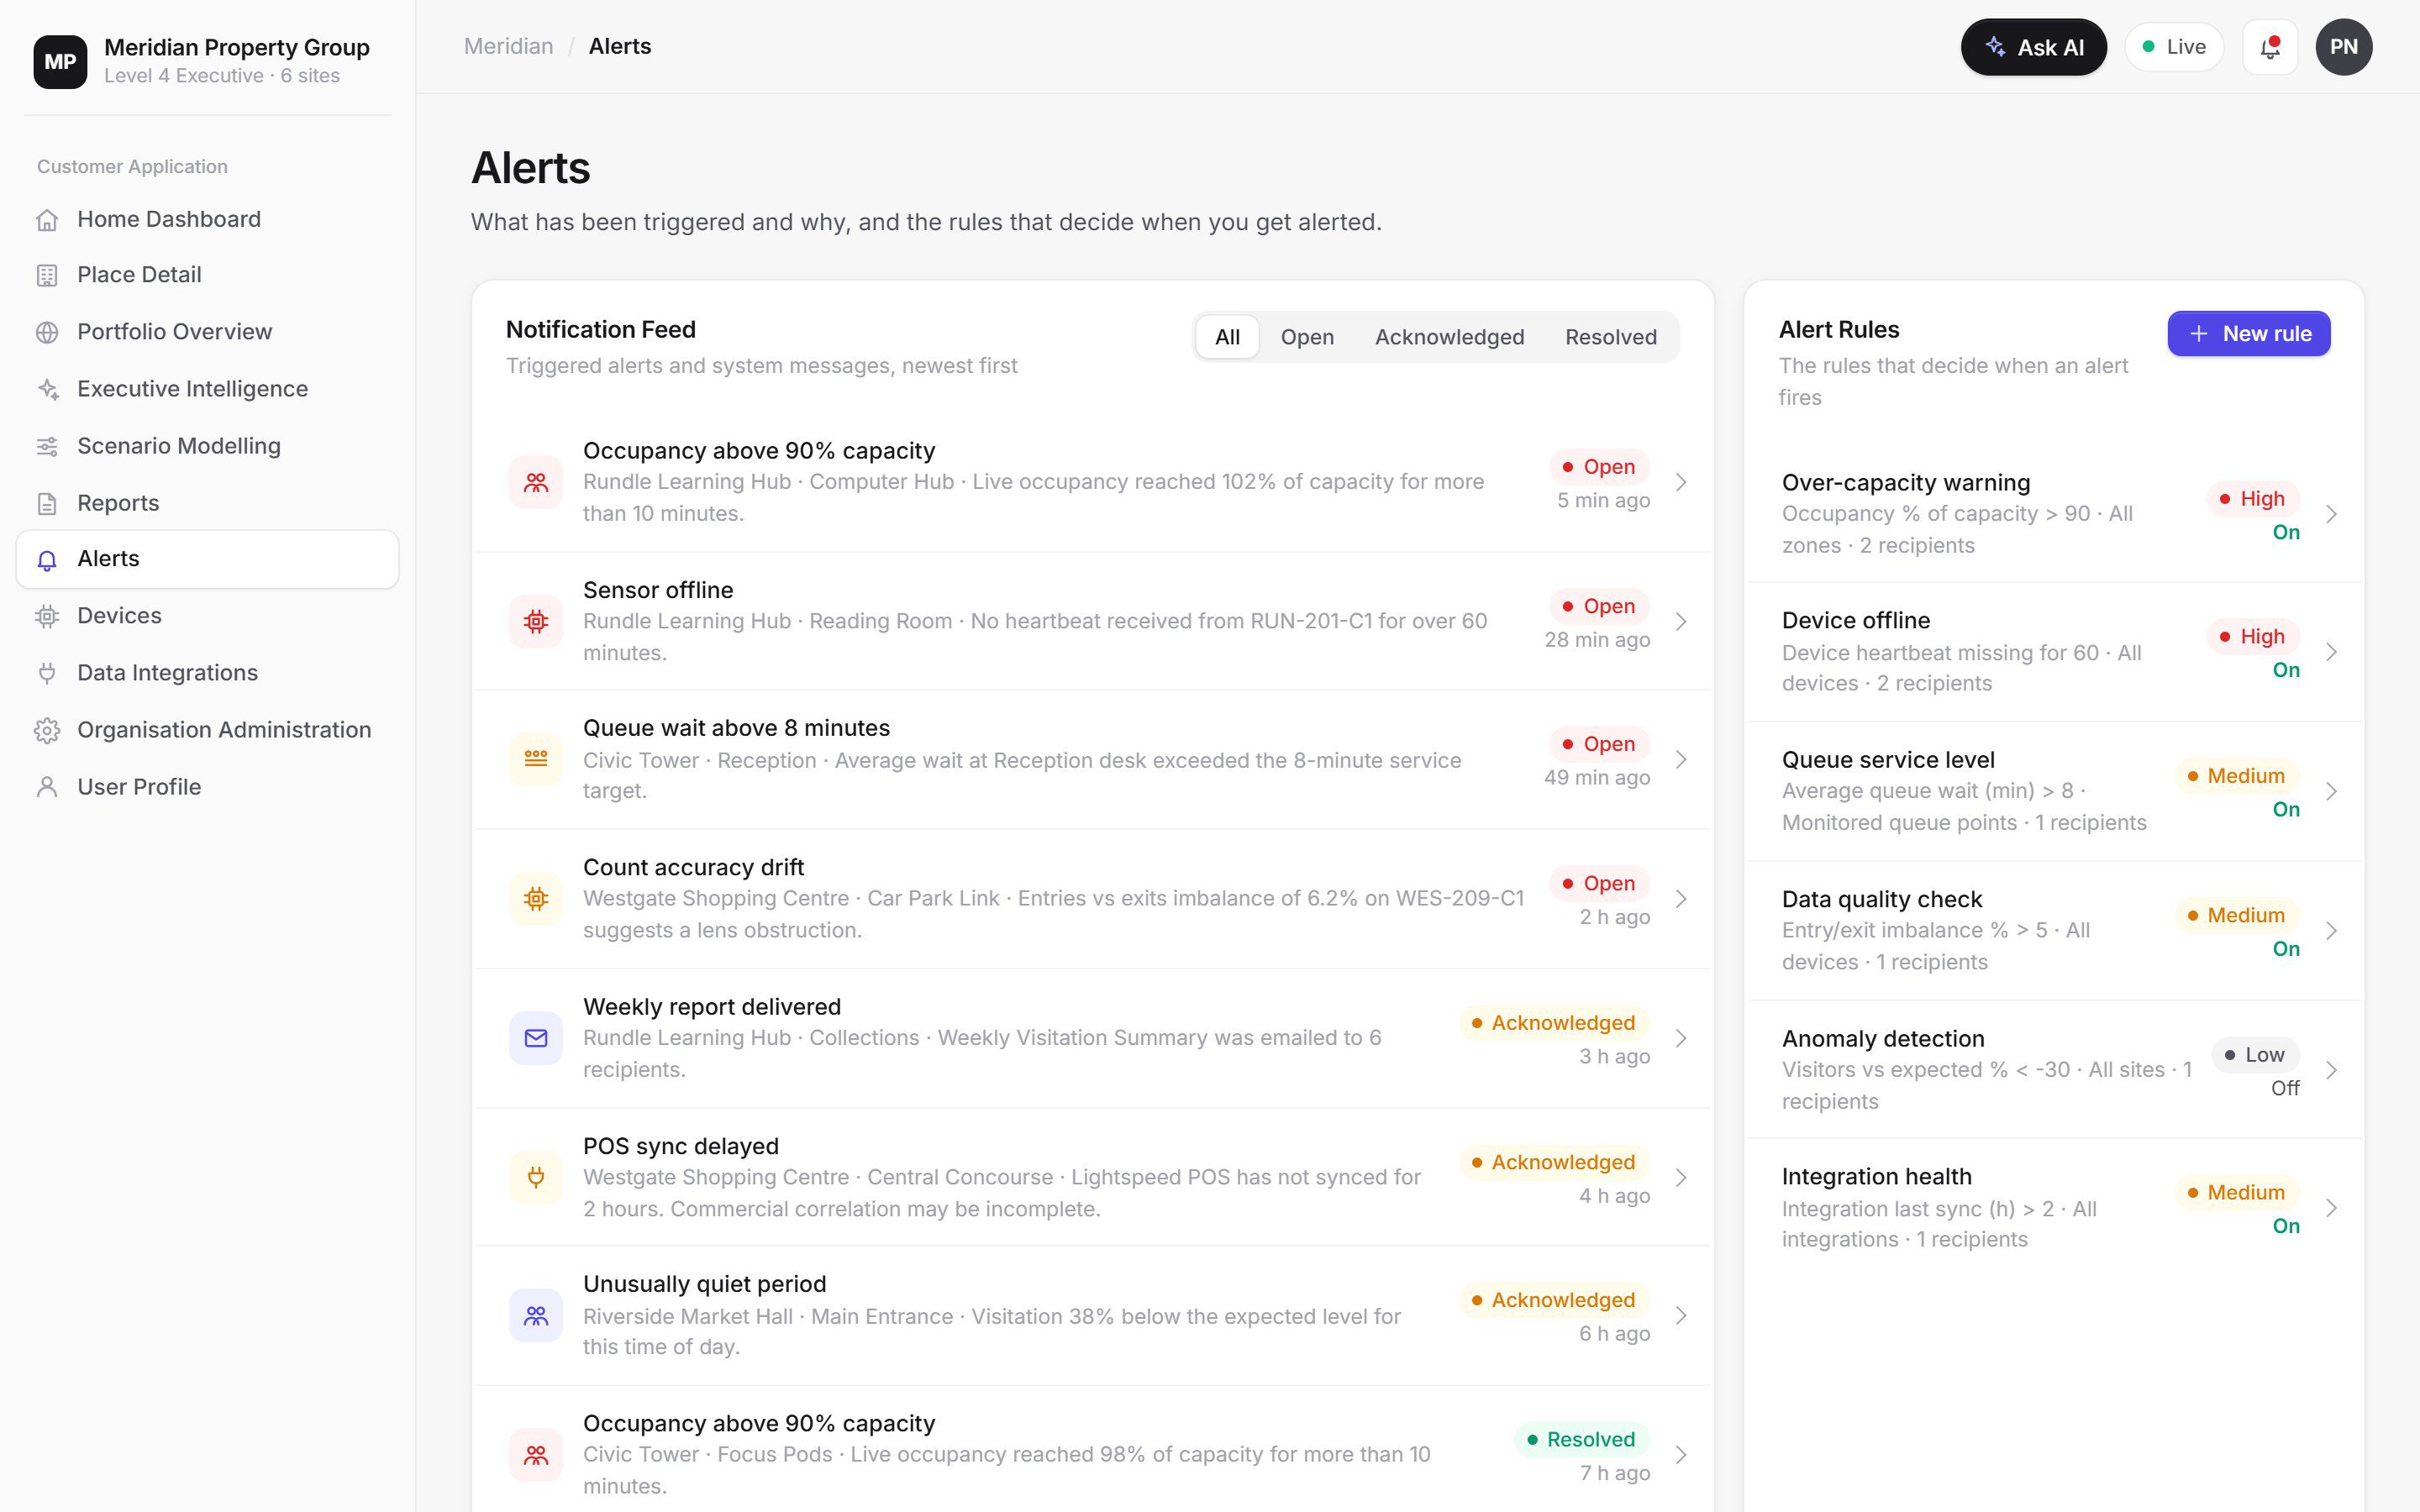
Alerts feed showing capacity and queue alerts

In the platform

Alerts that reach the right person.

Threshold rules watch occupancy, entry rates and sensor health. Alerts go to the right team by SMS, Teams, email or in-app, and escalate if nobody responds.

How it is installed

From site survey to live data.

Our Australian team designs, installs and supports every deployment, so you deal with one partner from the first survey to ongoing maintenance.

How the platform works

  1. Survey. We map gates, concourses and zones, and agree capacity limits and alert recipients.
  2. Design. Counters are planned for each gate and zone, permanent or temporary for a single event.
  3. Install and test. Devices are installed and tested against manual counts before doors open.
  4. Support on the day. Device health is monitored throughout, and alerts go straight to your operations team.

FAQ

Questions & answers

How do venues monitor crowd capacity in real time?

Counters at each gate measure people entering and leaving, giving a live attendance figure. Zone sensors compare occupancy in each area with its limit and raise alerts before limits are reached.

Can counting be set up for a one-off event?

Yes. Temporary deployments are available for festivals and single events, as well as permanent systems for venues.

Who receives capacity alerts?

Alerts can go to individuals or teams by SMS, Microsoft Teams, email or in-app, with escalation if an alert is not acknowledged.

Is venue crowd counting anonymous?

Yes. Processing happens on the device and only anonymous counts are sent.

Can it show which gates are busiest?

Yes. Entry counts and arrival rates by gate show where pressure is building, so staff can be redeployed or patrons redirected.

Can attendance be compared across events?

Yes. Every event is stored, so attendance, peak arrival times and zone occupancy can be compared to plan future events.

See your places in a new light.

Book a 30-minute walkthrough and we'll scope a pilot for one of your sites: sensors, installation, software and insights in one agreement.