
Government

Office occupancy analytics for government property.

Hybrid work changed how offices are used. See occupancy across every floor and site, consolidate with confidence, and report transparently to executives and ministers.

Parliament House, Canberra

Outcomes

What you can achieve.

  • Portfolio rationalisation. Compare utilisation across buildings and identify consolidation opportunities.
  • Workplace strategy. Understand attendance patterns by day and floor.
  • Safety and compliance. Capacity monitoring and evacuation counts for public-facing sites.
  • Transparent reporting. Executive packs ready for boards, ministers and audit.
  • Service centres. Queue and wait-time monitoring at shopfronts.
  • Energy savings. Condition and clean only the floors in use.

In practice

How it works on site.

Sensors count people as they move through each space. Counting happens on the device, and the numbers appear in the platform within seconds.

Animated illustration of a government service centre with queue monitoring and entrance counting3D people counterIN +1OUT +1Queue6 people ยท wait 5 minServed today312Target: under 10 min
Service centres: queue length, wait times and visits.
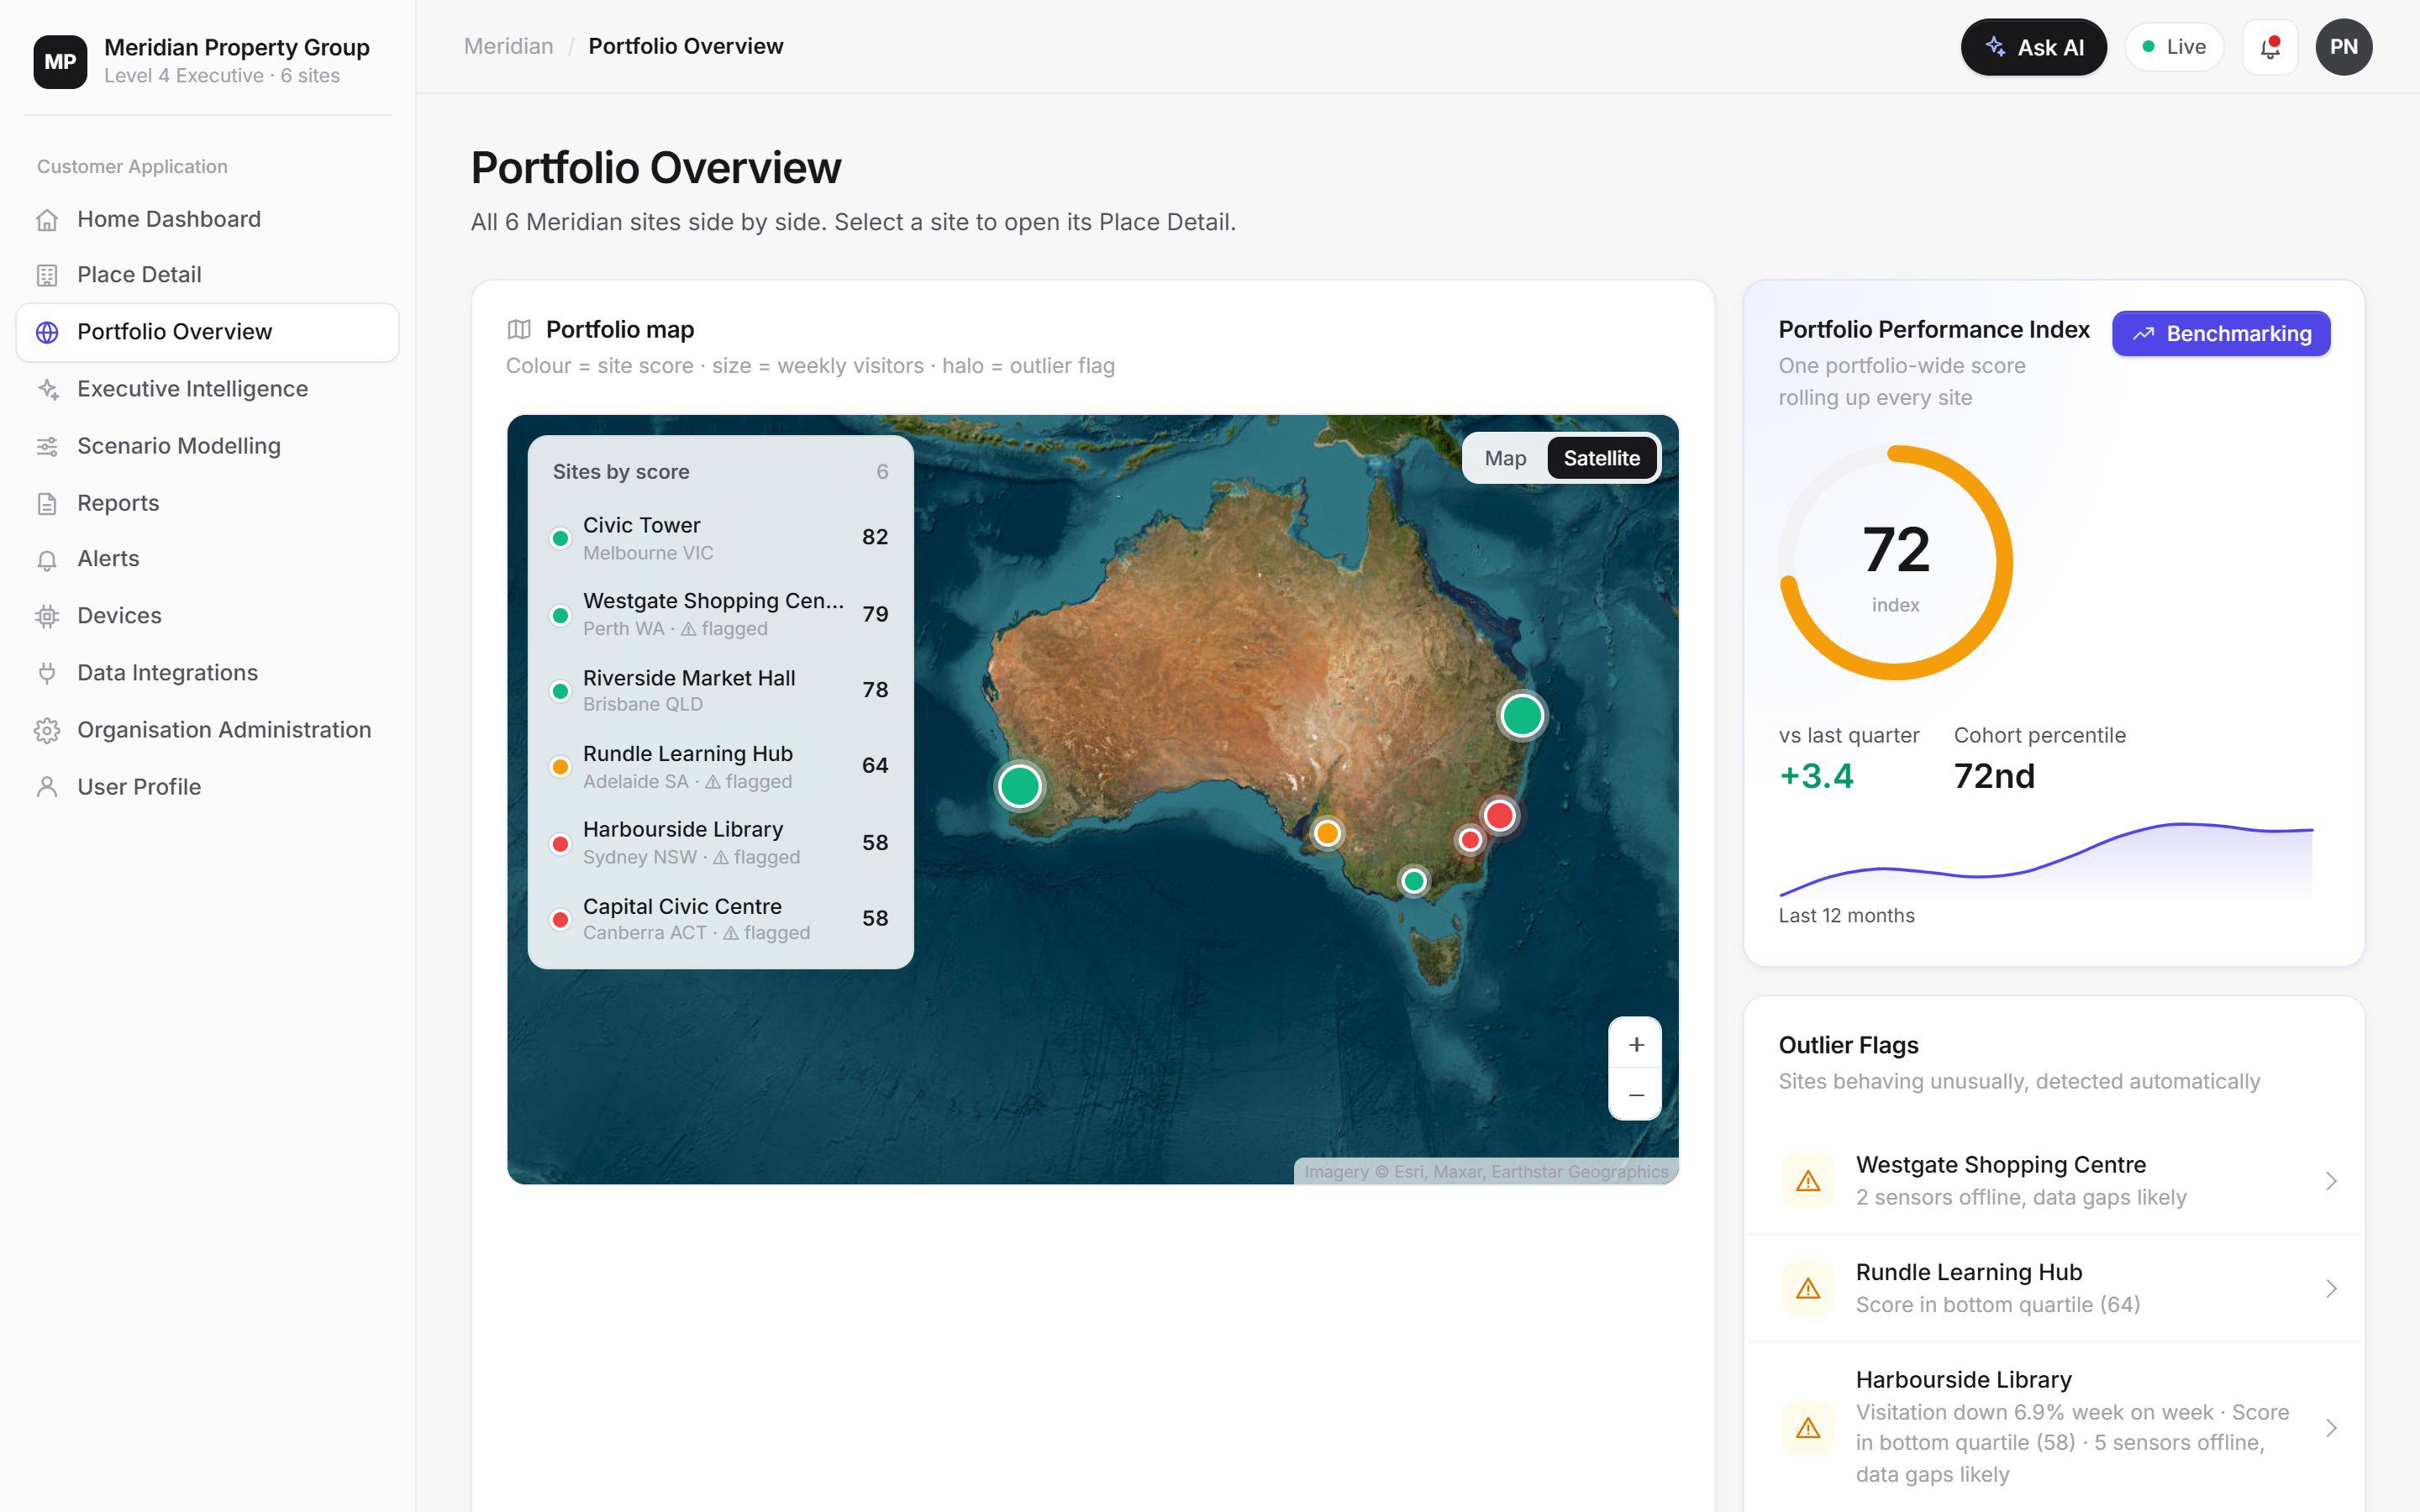
Portfolio overview with site ranking and map

In the platform

Compare every building in the portfolio.

Portfolio views rank sites by utilisation and performance, flag outliers and show where floors are consistently under-used, so consolidation decisions rest on evidence.

In the platform

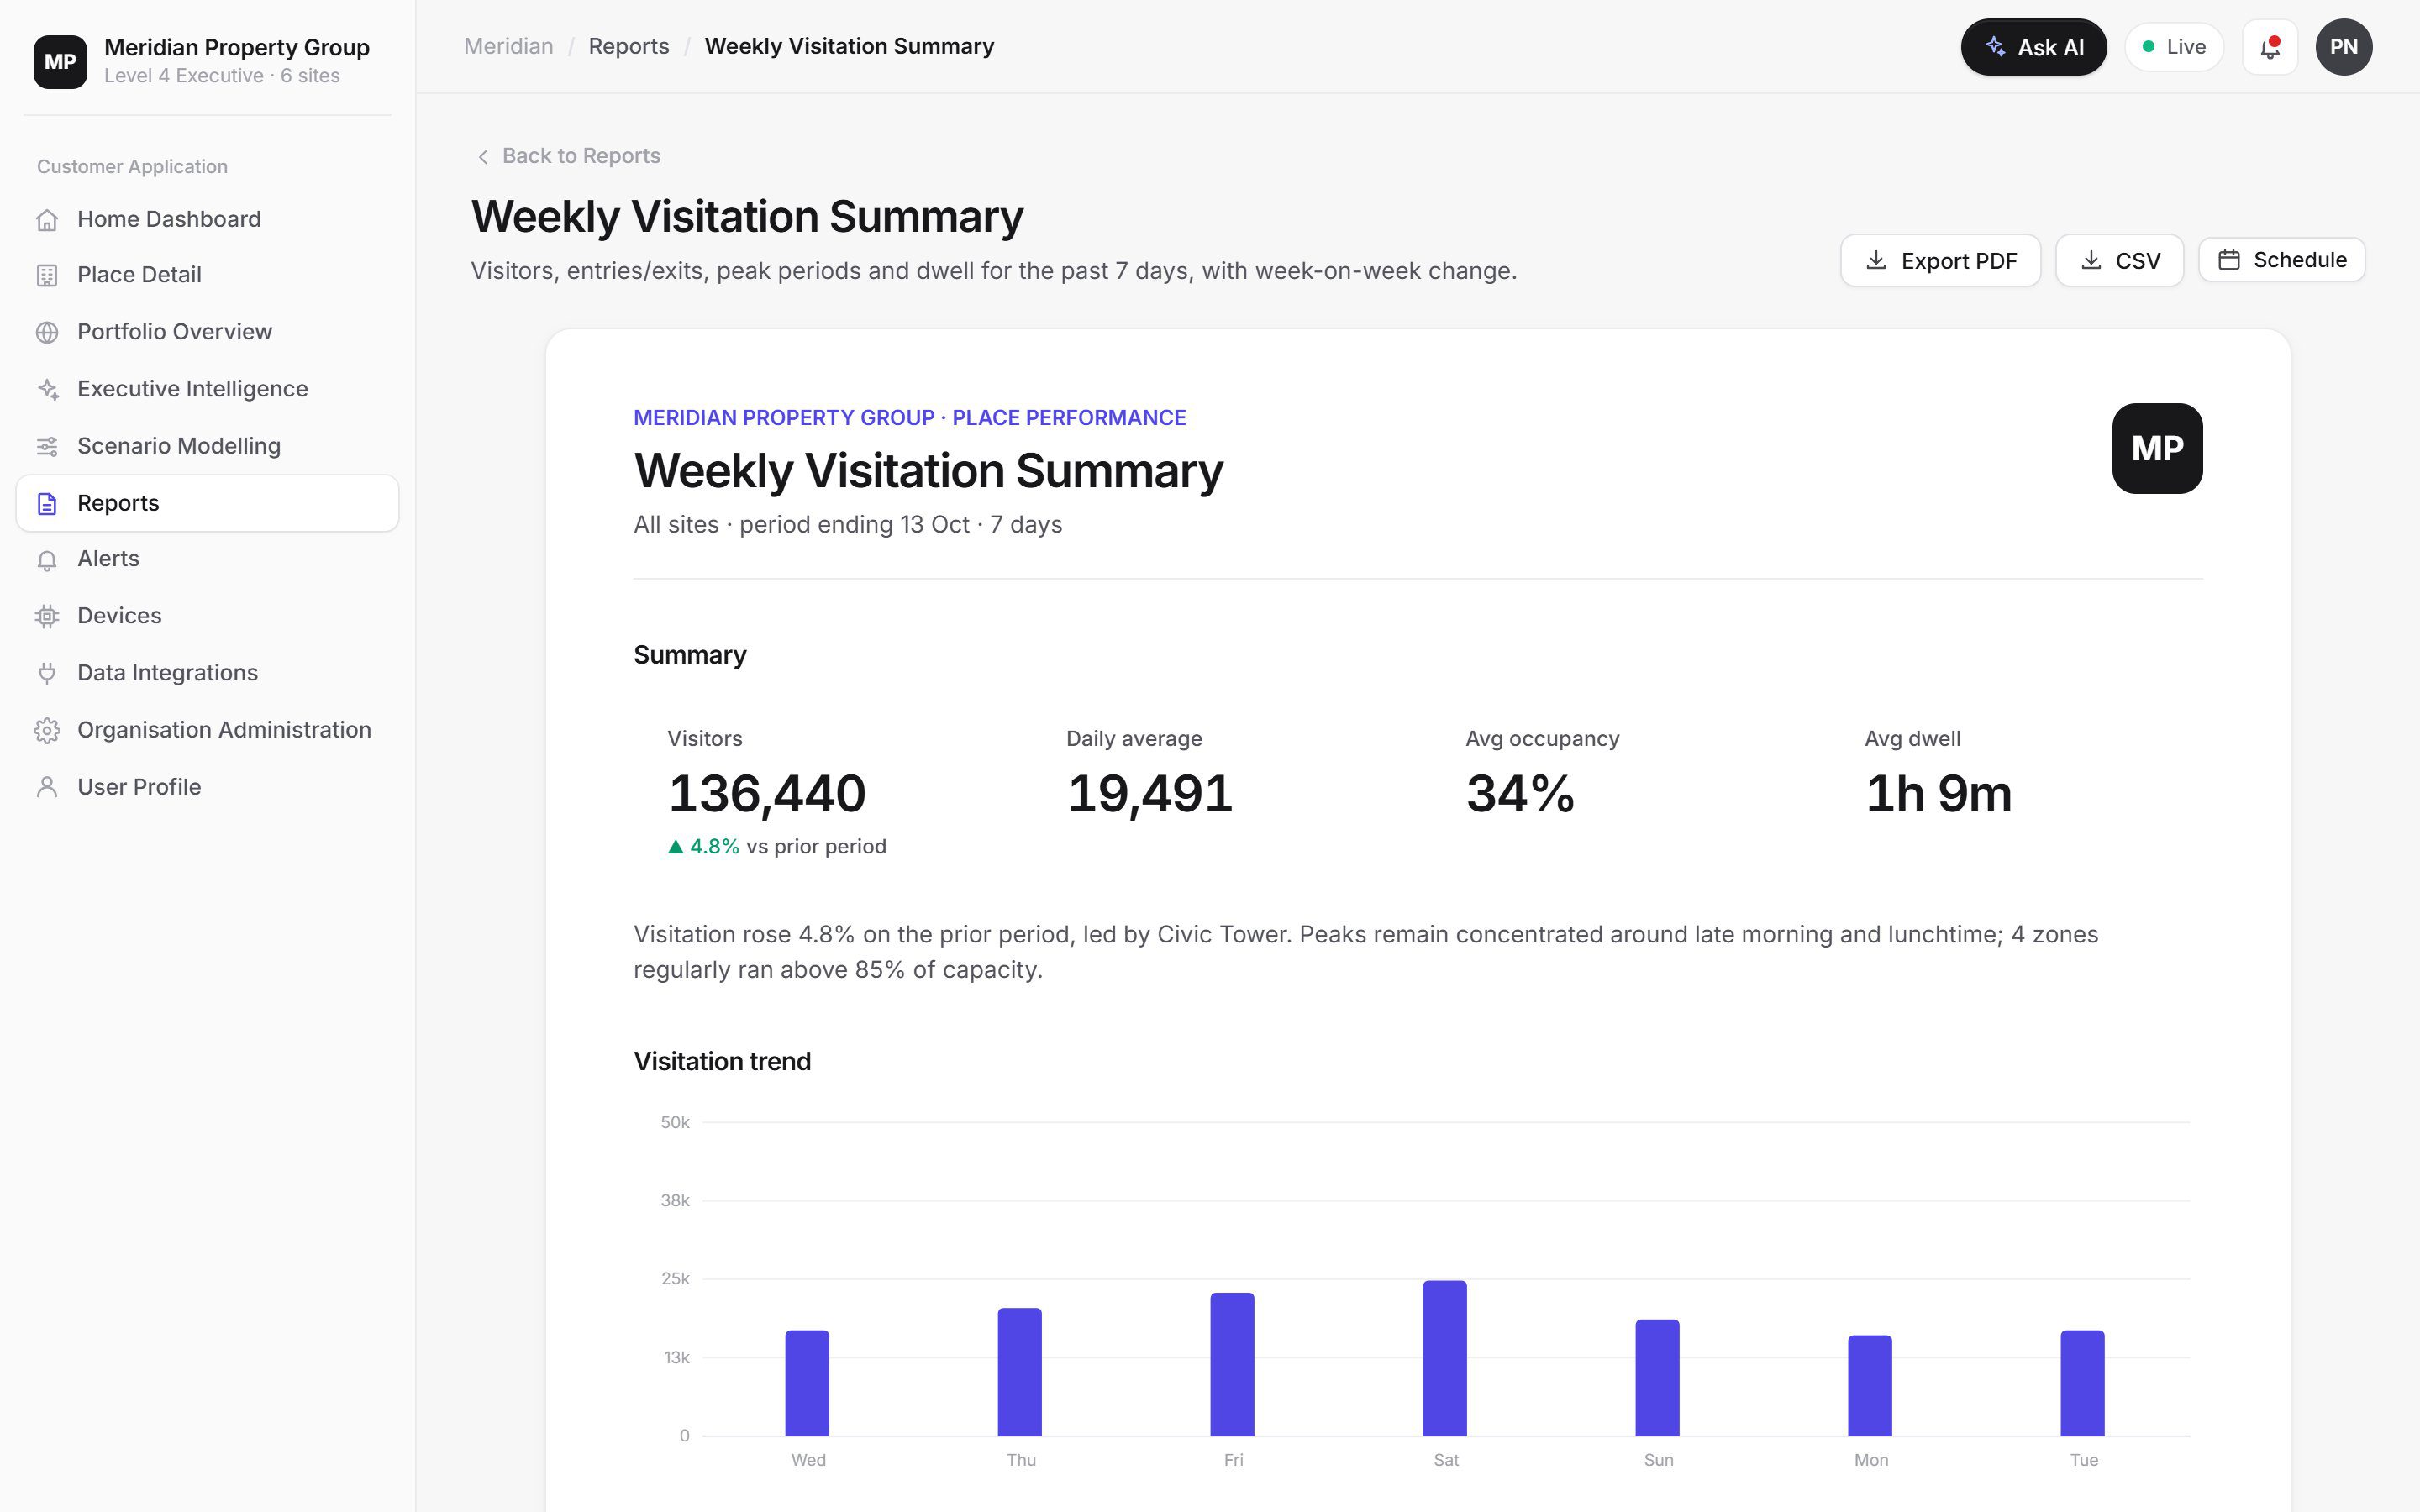
Report transparently, automatically.

Scheduled reports and board packs summarise attendance, utilisation and trends for executives and ministers without manual data gathering.

Weekly visitation report

Metrics

The numbers you get.

Floor utilisation

Average and peak occupancy per floor.

Attendance by weekday

Hybrid patterns across the week.

Portfolio ranking

Sites compared by utilisation and score.

Live occupancy

People on site now for safety.

Queue & wait

Service-centre wait against targets.

Trends

Change over months and years.

Guide

Office occupancy data for the public sector.

Hybrid work has changed how government offices are used. Attendance now varies by day, team and floor, and headcount or desk bookings no longer predict how much space is needed. Measured occupancy gives agencies an accurate, anonymous picture of real use.

Right-sizing the portfolio

Occupancy across every floor and building, compared over months, shows average and peak utilisation and identifies floors that are consistently under-used. Portfolio views rank sites so consolidation decisions rest on evidence. See how this works for government buildings and office towers.

Public-facing services

Service centres and shopfronts use queue and wait-time monitoring against service targets, with alerts when targets are at risk. Live occupancy supports capacity limits and emergency management at sites that welcome the public.

Transparent reporting

Scheduled reports and board packs summarise attendance, utilisation and trends for executives, ministers and audit, without manual data gathering. Forecasting and scenario planning help test the effect of consolidation before it happens.

Security and privacy

Counting is anonymous and processed on the device, access is role-based with single sign-on, and hosting arrangements can be discussed to meet agency requirements. Read more in privacy by design.

FAQ

Questions & answers

How can government agencies right-size office space?

By measuring actual occupancy on every floor over time, agencies can see average and peak utilisation by day, identify consistently under-used floors and buildings, and consolidate based on evidence rather than headcount or bookings.

Can it measure hybrid work attendance?

Yes. Occupancy by floor and day of the week shows hybrid attendance patterns, such as low use on Mondays and Fridays, without tracking individuals.

Is the data anonymous?

Yes. Sensors count people without identifying them, with processing on the device and no images or personal information collected.

Can it support evacuation and safety requirements?

Live occupancy shows how many people are in each building and floor at any moment, supporting capacity limits and emergency management at public-facing sites.

Where is the data hosted?

Hosting arrangements can be discussed to meet your agency's data and security requirements. Contact us with your requirements.

See your places in a new light.

Book a 30-minute walkthrough and we'll scope a pilot for one of your sites: sensors, installation, software and insights in one agreement.